No. The key assumption is that the allegedly solid surface is being seen in profile, which is equivalent to assuming that the line of sight is tangent to the allegedly solid surface. So long as the allegedly solid surface is spherical, the tangent line will not intersect the allegedly solid surface.
What's more, you needn't worry about the observer-at-infinity assumption. The 80000+ km of plasma along the line of sight remains the same even when the observer is at some other distance, such as an astronomical unit, but the calculation becomes slightly harder to visualize.
An observer closer than infinity sees less than half the surface of the sun. That changes the projection seen by the observer, which could invalidate any distances obtained by counting pixels in the projected image. As it happens, the camera was far enough away to justify the observer-at-infinity approximation, so counting pixels is not a bad way to estimate the size of features
that are known to be orthogonal to the line of sight.
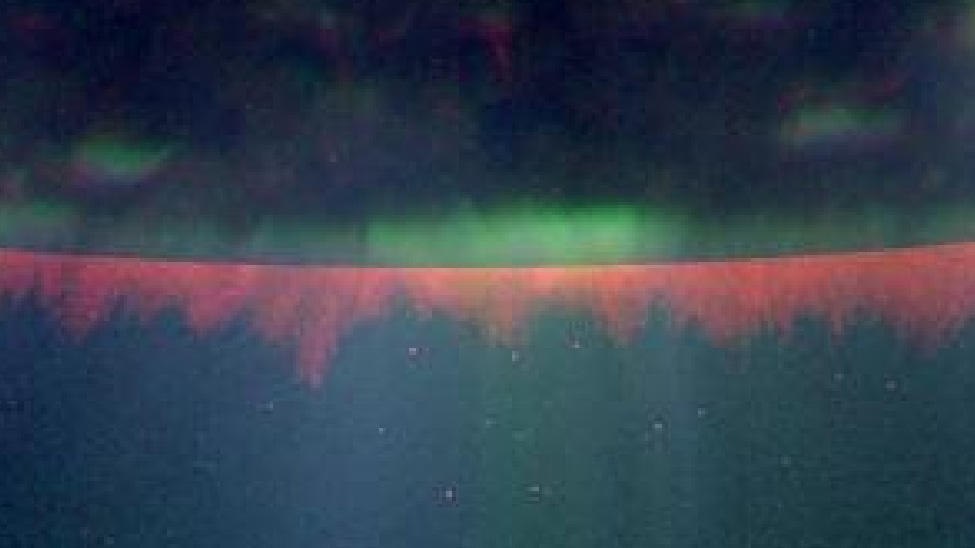
There is no reason to assume the bright green line near the limb represents a feature that's orthogonal to the line of sight. We're accepting
Michael Mozina's 4800 km estimate just for the sake of argument. That 4800 km estimate implies the line of sight passes through 80000+ km of plasma. If the physicists tell me that
such transparent plasma is highly improbable, then I'm going to conclude that
Michael Mozina's interpretation of the image is highly improbable.

")
")