Electric universe theories here.

Status
Not open for further replies.
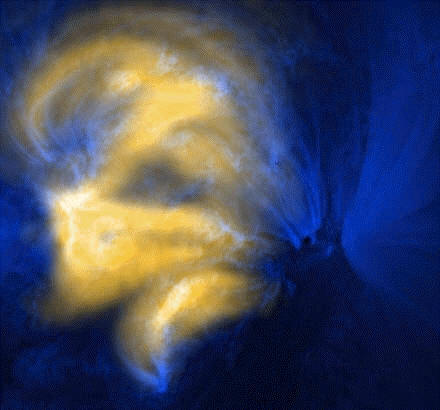
The primary light sources are obvious to everyone - the corona in general and the coronal loops.

What do you mean when you say "the corona in general"? Do you mean as in Thompson scattering, or do you mean the coronal plasma is thermally heated by the coronal loops? Both? Please elaborate on this point a bit. I will agree that the the coronal loops are the primary light source of the original images. The corona in general as you describe it is "relatively" dark. It's also a plasma meaning light from the loops will scatter as it interacts with the solar plasma.

For these images we do not need to know "what coronal loops are,

You have to have some idea of the original light source to be able to describe cause and effect relationships, and to describe the physical processes that create these images. Electrical discharges in nature are known to release these sorts of emissions. Birkeland's experiments "predicted" them to exist in the solar atmosphere.

what heats them to millions (sometimes tens of millions) of degrees Kelvin over the visible length of the loop,

Again, discharges in plasma tend to heat plasma to millions of degrees. Sustained discharges can forms as "plasma filaments" like we see inside of an ordinary plasma ball. They emit light over the whole filament due to the electrical current running through the plasma. We certainly see plenty of evidence that these high energy emissions are directly related to the discharges predicted in Birkeland's physical experiments.

what sustains them for hours at a time,

That's quite an enigma for a "magnetic reconnection" proponents. It's one thing to release energy as a "burst" at plasma a crossing point. It's quite another trick to release energy over the whole course of the plasma thread, and sustain it for hours! Nice trick wouldn't you say?

where they originate,

Oh, we will definitely have to have some idea about where they originate in order to explain even the original images properly, let alone the RD images.

They exist, they have temeratures of millions of K ove rmost of their length, they ares ustained, they originate. There are answers to some of thess irrelevant (to the image question).

These are not "answers" in terms of "cause and effect" relationships. Whereas Birkeland demonstrated a physical cause/effect relationship between "current flow" and coronal loops in the atmospheres of terellas in a vacuum, you are not "explaining" even the light source of the original images. That isn't an "explanation", that like "skipping ahead".

The only "delusion" going on here is that you are "explaining' anything by simply taking everything for granted in the original images. In other words, you identified no cause/effect relationships as to why these emissions are there, how they are sustained, etc. You simply *assume* they are there and provide no insight as to how they got there, how they stay there, how they change over time, etc. How then can you analyze an image that provides us images that "change over time" and that show areas that do not change over time? Without identifying the "cause" of the loops, you also fail to identify the "cause" of the changes in the images.
 
Last edited:
MM, so what is the ratio of electrons to positive ions in the solar wind?

My guess is that would depend on where we measured it. In other words, I would expect that some of the protons pick up electrons from the solar wind, and become neutral hydrogen atoms along the way. Maybe electrons that leave the surface after a proton catch up to slower moving protons in the wind.

The charge attraction process allows us to "explain" why solar wind is composed mostly of H+1, He+2 and He+1 ions in that specific order. The lighter the element and the greater the charge, the more attracted it is to the electrons flying off the surface and the more it accelerates over time. Heavier particles are more affected by gravity than the lighter elements so there is an elemental separation process that takes place, probably far below the photosphere.

Is it high enough to create the flow of the solar wind in your model?

Well, in Birkeland's experiments he found pieces of the terella stuck to the grease on the sides of his chamber. He had to periodically clean the sides of his chamber. I would assume that yes, the "current flow" would have to be sufficient to pull the protons along for the ride, but many of the electrons may eventually 'reconnect' with protons in the solar wind.

I am assuming that for every proton (H+ ion) there would have to be more than 1038 electrons, and quadruple that for the alpha particles.

That's probably true closest to the surface of the sun. That's evidently not the case by the time it reaches Earth. Some "reconnection" must be occurring in the process, and some protons pick up electrons along the way. I believe there was an article about this occurring in a comet tail resulting in a decrease in the solar wind speed in the tail. I'll see if I can find the article.

And you still have to factor in overcoming the repulsive force of the positive ion, right?

I think you might find it advantageous to think of the heavier protons and ions as "conductors", much like we find in an ordinary plasma ball. The electrons flow through the plasma ions as well as cause them to move and form filamentary shapes. The same is true of the sun. The flow of electrons sometimes form "ropes" which can connect to the Earth and pump huge amounts of energy into the Earth, including both electrons and protons.

So does the observed ratio of electrons to positive ions match what your theory predicts?

I have a lot more studying to do before I could "predict" things that fit all the observations with enough accuracy for me to feel any level of comfort. I understand the basic principles just fine, but the dynamic nature of solar wind for instance is very difficult to predict. I'm learning how to do that, but I've only recently been studying the ACE data on a regular basis. The best "numbers" I could provide you at the moment would be from the THEMIS program where they watched a magnetic rope (described by Alfven as a current carrying z-pinched plasma thread) connect to the Earth and pump five hundred thousand billion joules of energy into the Earth over a few hours.

http://www.nasa.gov/mission_pages/themis/auroras/northern_lights.html
 
Last edited:
It's not Dr. Hurlburt's claim, Michael. It's yours.

You're the one that claimed "Flying stuff? What flying stuff?" Let's seem him back you up on that claim? Let's see him backup you claim that the RD technique itself is responsible for persistent features in the image? You claimed you had a better "explanation" for the image. Where is it? So far you explained nothing specific about these specific images, you've made several false statements, and none of you have "explained" any physical cause/effect relationships observed in either the original or RD images.

I'm sure the author of the image could provide us with a few details, and few cause/effect explanations related to this specific image and the CME event we observe in the images. Let's hear it?

And so far you haven't been able to explain the image.

I haven't really tried to "explain" anything yet, at least not here. I'm simply trying to see what you folks can come up with based on standard solar theory. So far it's really sad. Nothing specific to the image has been "explained" in any way.

He did, however, already say that what you believe to be a surface in the image, isn't a surface at all. That particular issue was put to rest over three years ago.

This is simply an irrational premise on your part, as though a single appeal to authority fallacy would somehow "put the issue to rest". That won't cut it. If he has actual physical "explanations" to offer us for these persistent features, let's hear it? Your personal claim that it was directly related to the imaging technique was utterly false, so I'll need a better "answer".

It actually only takes a rudimentary understanding of what a running difference image is.

You don't even have a rudimentary level of understanding of RD images or you would never have claimed that the technique itself was responsible for persistent features in the images. You've said that twice now in our conversations. That is physically impossible. Whatever is responsible for persistent features in the image, it is directly related to a *SOLAR PROCESS OF SOME KIND* and not the imaging technique itself. RD images of the solar atmosphere in LASCO images show no stable fixed "structures" or "angular patterns". The show changes caused by moving flowing plasma and those patterns change dramatically over time.

You have yet to demonstrate, objectively and quantitatively, that anyone can see anything deeper than about 500 kilometers into the photosphere.

BS.

mossyohkoh.jpg


This image shows us that the 171A wavelengths penetrate much deeper into the solar atmosphere than the x-ray images. Then again, you won't actually address any of these images directly or the evidence they provide us with.

Describe the method you think will work. Because without that method, a method other people can apply and come to the same conclusion as you, then your method is scientifically useless.

Well, given an unrestricted budget and lots of helpers, the "method" I would tend to use is to create a neon plasma in a tube, use an arcwelder type device to ionize some iron, and see how far that light penetrates the plasma. I'd do the same thing with silicon plasma. At some point I'd need to know the density of the photosphere with absolute precision and I'd need to make some estimates based on what I learned in a lab. I'm not like you guys where I just "wing it", never experiment and lab, and make it up as I go.
 
Last edited:
My guess is that would depend on where we measured it. In other words, I would expect that some of the protons pick up electrons from the solar wind, and become neutral hydrogen atoms along the way. Maybe electrons that leave the surface after a proton catch up to slower moving protons in the wind.

The charge attraction process allows us to "explain" why solar wind is composed mostly of H+1, He+2 and He+1 ions in that specific order. The lighter the element and the greater the charge, the more attracted it is to the electrons flying off the surface and the more it accelerates over time. Heavier particles are more affected by gravity than the lighter elements so there is an elemental separation process that takes place, probably far below the photosphere.


Well, in Birkeland's experiments he found pieces of the terella stuck to the grease on the sides of his chamber. He had to periodically clean the sides of his chamber. I would assume that yes, the "current flow" would have to be sufficient to pull the protons along for the ride, but many of the electrons may eventually 'reconnect' with protons in the solar wind.


That's probably true closest to the surface of the sun. That's evidently not the case by the time it reaches Earth. Some "reconnection" must be occurring in the process, and some protons pick up electrons along the way. I believe there was an article about this occurring in a comet tail resulting in a decrease in the solar wind speed in the tail. I'll see if I can find the article.


I think you might find it advantageous to think of the heavier protons and ions as "conductors", much like we find in an ordinary plasma ball. The electrons flow through the plasma ions as well as cause them to move and form filamentary shapes. The same is true of the sun. The flow of electrons sometimes form "ropes" which can connect to the Earth and pump huge amounts of energy into the Earth, including both electrons and protons.


I have a lot more studying to do before I could "predict" things that fit all the observations with enough accuracy for me to feel any level of comfort. I understand the basic principles just fine, but the dynamic nature of solar wind for instance is very difficult to predict. I'm learning how to do that, but I've only recently been studying the ACE data on a regular basis. The best "numbers" I could provide you at the moment would be from the THEMIS program where they watched a magnetic rope (described by Alfven as a current carrying z-pinched plasma thread) connect to the Earth and pump five hundred thousand billion joules of energy into the Earth over a few hours.

http://www.nasa.gov/mission_pages/themis/auroras/northern_lights.html

Thanks for the response, more tomorrow.

If the numbers of protons and electrons are roughly equal, how would that accelerate the protons?

You have the Electron's Momentum and the Proton's Momentum, and if the electrons are towing along the positive ions, it seems to me that the eMom would have to be equal or greater than the pMom other wise there is no way that the eMom generated by the attraction of the electron to the heliosphere is going to acclerate the protons.

Am I missing something?
 
I mean the corona in general, i.e. the corona that you are ignorant about.

Whereas Tim and Dancing David seem to be capable of engaging in a normal conversation and exchanging ideas intelligently, in an adult manner, you and GeeMack continue to muddy the discussion with superfluous rant. You did not answer my question. How are you taking Thompson scattering into effect when you're trying to measure the temperature of the whole corona?
 
Whereas Tim and Dancing David seem to be capable of engaging in a normal conversation and exchanging ideas intelligently, in an adult manner, you and GeeMack continue to muddy the discussion with superfluous rant. You did not answer my question. How are you taking Thompson scattering into effect when you're trying to measure the temperature of the whole corona?


How high are the mountains in the running difference image, Michael? How deep are the valleys? What objective method do you use to determine that? How can we apply your objective, quantitative method to come to the same conclusion you reached?

Hint: You can admit that you don't know high how high or how deep and that there is no objective basis for your determination. You can admit that your analysis is scientifically useless since there is no objective method for reaching your conclusion.

Or, you could just continue to be an ignorant crackpot and not even acknowledge the question, which, based on several years worth of evidence, is how you'll deal with this.
 
Micheal Mozina's "mountain ranges on the sun's surface" idea

Micheal Mozina has been trolling the internet forums for many years now (since at least 2006) touting the Iron Sun idea.

One of his persistent misconceptions (i.e. delusions) is that the TRACE mission took images of mountain ranges in the sun's surface. Here the "sun's surface" is not the visible surface of the sun (photosphere) but a hypothetical solid iron surface with an unspecified temperature (less than 2000 K otherwise it would not be solid).

The TRACE images were actually processed by computer into a running difference (RD) animation where each frame is created by subtracting the previous frame from it. It is this animation that MM claims shows the mountain ranges (not the original images) on a < 2000 K surface below the ~6000 K photosphere.

Here is the caption for one of the frames from the animation on his web site:
This is an example of a "running difference" image of the sun's surface revealed by the TRACE satellite using its 171 angstrom filter. This filter is specifically sensitive to iron ion (FE IX/X) emissions and records a C3.3 flare and mass ejection in AR 9143 in 171Å on 28 Aug. 2000. The flare activity is caused by increased electrical activity as fast moving plasma sweeps over surface ridges, resulting in increased electrical activity on the windward side of the mountain ranges.
Note that he describes the RD image as if it was an actual photograph of his hypothetical solid iron surface.

The first thing that is wrong is that MM does not comprehend what a running difference image is. It is a record of the changes between the images. It never records persistent features like mountain ranges. This is easily seen by any photographer. Take a photo of a mountain. Take another photo of a mountain. Subtract the first photo from the second. The mountain vanishes and what you see are changes, e.g. clouds moving, birds flying and perhaps shadows moving.
Astronomers know what the features on the RD animation are because they do not ignore the original images (unlike MM).
This is a snapshot of Active Region 9143 observed with TRACE in the 171Å passband, showing bright material around 1 million degrees. This image, taken at 17:07UT on August 28, 2000, shows the corona during a C3.3 flare, associated with a mass ejection (towards the upper left of the image). The associated 3.3MB AVI movie (Cinepak compressed) shows the flare and mass ejection as a difference movie: where the image turns bright, the solar corona has become brighter after 16UT, and where it turns black it has dimmed. This shows the ejected material very well, first flying upward at several hundred kilometers per second. Later, some of it is seen to fall back as a dark cloud.

Secondly: MM's "mountain ranges" are not persistent. They appear out of nowhere and change during the animation. His explanation seems to be changing "light sources" but this is easily seen to be incorrect. RD removes and static light sources. The light sources in this case are the corona in general, the solar flare and the coronal mass ejection. The "mountain ranges" just happen match the position of the solar flare for some strange reason. So their slopes will be illuminated equally by the flare. The CME appears in the upper right. The "shadows" in the RD animation are not toward the lower left and so are not cast by the CME.

Thirdly: The TRACE satellite was using its 171 angstrom filter (pass band). This detects light from material with a temperature of between 160,000 K and 2,000,000 K. The corona is plasma heated to withing this range (see the "around 1 million degrees" above). The photosphere has been measured to emit light with a near black body spectrum peaking at 5777 K. The photosphere does actually emit a tiny amount of 171A light - the spectral irradiance vs wavelength on the Wikipedia page has 17.1 nanometers as zero irradiance but that is a result of the scales being used. Detecting that tiny radiation through the massive spectral irradiance of the corona in this pass band is like detecting the light from a candle through the light of a forest fire. It is even worse any hypothetical solid iron surface an < 2000 K since there is less radiation at 171A for a lower temperature black body.
Therefore the TRACE images are of activity in the corona and the RD animation is of changes in that activity in the corona.

Fourthly:
This is not really related to the image but is about the possibility of a hypothetical < 2000 K solid iron surface existing under a measured plasma of ~6000 K.
There is the second law of thermodynamics, which can be states as "Heat generally cannot flow from a material spontaneously at lower temperature to a material at higher temperature.".
MM has not yet explained how the photosphere can violate the second law of thermodynamics. He has to explain how the solid iron surface remains < 2000 K despite the fusion happening below it and then what makes the photosphere hotter than the iron surface. There must be fusion happening in the Sun since the neutrinos from it have been detected (an out-dated alternative is fission but then there is the same problem). If this fusion happened above the solid iron surface then the photosphere would be millions of degrees hot. Thus it must be below the solid iron surface. Therefore the solid iron surface cannot exist!
 
Whereas Tim and Dancing David seem to be capable of engaging in a normal conversation and exchanging ideas intelligently, in an adult manner, you and GeeMack continue to muddy the discussion with superfluous rant. You did not answer my question. How are you taking Thompson scattering into effect when you're trying to measure the temperature of the whole corona?
What has Thompson scattering got to do with it?
Scientists measure the temperature of the photosphere and corona. That is a measurement of temperature. It does not matter what mechanism heated the plasma. It is measured to be at that temperature.

Available for you to ignore:
Temperature of the Solar Corona from Intensity Gradients Measured during the May 30, 1965 Total Eclipse
 
Last edited:
Just noticed a bit more crackpottery from Micheal Mozina.
Here is the caption for one of the frames from the animation on his web site:
This is an example of a "running difference" image of the sun's surface revealed by the TRACE satellite using its 171 angstrom filter. This filter is specifically sensitive to iron ion (FE IX/X) emissions and records a C3.3 flare and mass ejection in AR 9143 in 171Å on 28 Aug. 2000. The flare activity is caused by increased electrical activity as fast moving plasma sweeps over surface ridges, resulting in increased electrical activity on the windward side of the mountain ranges.
The PDF in his "increased electrical" link is Radio and Hard X–ray Images of High–Energy Electrons in an X-class Solar Flare and its abstract is
We present the first comparison between radio images of high–energy electrons accelerated by a solar flare and images of hard X–rays produced by the same electrons at photon energies above 100 keV. The images indicate that the high–energy X–rays originate at the footpoints of the loops dominating the radio emission. The radio and hard X–ray light curves match each other well and are quantitatively consistent with an
origin in a single population of nonthermal electrons with a power law index of around 4.5–5. The high-frequency radio spectral index suggests a flatter energy spectrum but this is ruled out by the X–ray spectrum up to 8 MeV. The preflare radio images show a large hot long–lived loop not visible at other wavelengths. Flare radio brightness temperatures exceed 109 K and the peak in the radio spectrum is as high as 35 GHz: both
these two features and the hard X–ray data require very high densities of nonthermal electrons, possibly as high as 10^10 cm^-3 above 20 keV at the peak of the flare
But the paper's conclusion are clearer:
Observations of the 2002 July 23 event are consistent with the general picture of nonthermal electrons at energies of many hundreds of keV radiating at radio wavelengths as they travel along the coronal portion of the loop and 100–150 keV HXR when they strike the chromosphere at the
footpoints of magnetic field lines.

In other words the paper directly contradicts MM's caption. The "increased electrical activity" is taking place as electrons pass from the coronal portion of the loop to the chromosphere - about 2000 km above the photosphere. There is no fast moving plasma sweeping over ridges in a hypothetical solid iron surface below the photosphere.
 
In other words the paper directly contradicts MM's caption. The "increased electrical activity" is taking place as electrons pass from the coronal portion of the loop to the chromosphere - about 2000 km above the photosphere. There is no fast moving plasma sweeping over ridges in a hypothetical solid iron surface below the photosphere.


For the $million... I predict our math challenged resident crackpot will ignored this, or if acknowledged, he will simply deny it without any effort to legitimately or scientifically refute it. (Too easy? No million bucks for me?)
 
How high are the mountains in the running difference image, Michael? How deep are the valleys?

That is impossible to answer from a running difference image since each pixel in the image represents hundreds of kilometers.

What objective method do you use to determine that?

I tend to be more inclined to go with the heliosiesmology data personally.

How can we apply your objective, quantitative method to come to the same conclusion you reached?

Well, the quantitative methods of analyzing the location of the crust are spelled out in Kosovichev's paper. The qualitative (interpretative) process is spelled out (qualified) by Birkeland's series of controlled experiments and the other key satellite imagery like the RD images, the Doppler images and that composite TRACE/Yohkoh image.

Hint: You can admit that you don't know high how high or how deep and that there is no objective basis for your determination. You can admit that your analysis is scientifically useless since there is no objective method for reaching your conclusion.

Were it not for heliosiesmology findings of a "stratification subsurface" that changes over time, you might have a point. Since that is not the case, we're going to have to debate the merits of all "interpretations" of the data sets, all the images and the various findings.

I can only image how frightened you must be if you still feel the need to insert pointless and childish name calling into every post. You must be pretty desperate.
 
What has Thompson scattering got to do with it?
Scientists measure the temperature of the photosphere and corona.

How do they measure the temperature of various points in the corona, and how might Thompson scattering effect the images? One thing is very clear. The loops themselves are the brightest and hottest parts of the image. The dark regions in the composite image need not have reached the same temperatures as the light regions, in fact it unlikely that they do, or we would observe it in these images. Some amount of "scattering' is highly likely considering the whole atmosphere is made of moving charge particles.

That is a measurement of temperature. It does not matter what mechanism heated the plasma. It is measured to be at that temperature.

Light from the loops will be scattered in the various plasma layers and the solar atmosphere in general. We can't simply "assume" that a few scattered photons in the atmosphere of image necessarily shows that all the plasma is radiating at tens of millions degrees, even if the loops are that hot. Photons from the loops will be scattered by the process, and the movement of electrons through the solar atmosphere will also tend to heat plasma along the way due to collisions with plasma. It's a very complicated process.


Actually, I won't ignore it, but the odds are that I won't have the time to read tonight.
 
In other words the paper directly contradicts MM's caption. The "increased electrical activity" is taking place as electrons pass from the coronal portion of the loop to the chromosphere - about 2000 km above the photosphere. There is no fast moving plasma sweeping over ridges in a hypothetical solid iron surface below the photosphere.

"Flare radio brightness temperatures exceed 10^9 K and the peak in the radio spectrum is as high as 35 GHz: both these two features and the hard X–ray data require very high densities of nonthermal electrons, possibly as high as 1010 cm􀀀3 above 20 keV at the peak of the flare."

How about those observations of "very high densities of electrons"? You aren't even going to comment on them? How can you read this whole paper and not notice the important points?

Yes, they are in fact assuming that the *RADIO* spectrum footprints are located in the chromosphere. For all I know the radio waves are not visible below the chromosphere and photosphere and they are completely correct about the location where they observe the base of the radio wave spectrum. For instance that x-ray spectrum in the Trace/Yohkoh image make it clear that the "base" of the loop that is visible in each spectrum is different. The yellow x-rays do not seem to penetrate below the photosphere, whereas the 171A photons penetrate further, and therefore the observed bases of the loops are much deeper.

mossyohkoh.jpg


I can neither agree or disagree on their placement of the radio waves in comparison to other wavelengths, but that would place them somewhere between the x-rays and the iron ion wavelengths in terms of penetration depth. That hardly sounds surprising from my perspective. I fail to see why you think that has any effect on the caption.

Now how about you explain all those non thermal electrons for us?
 
Last edited:
"How about those observations of "very high densities of electrons"? You aren't even going to comment on them? How can you read this whole paper and not notice the important points?
I do not need to comment on the high density of electrons.

I read the paper and noticed the important part as stated in the conclusion (which you have ignored - I guess GeeMack would get a million dollars in the JREF Challenge!)
Observations of the 2002 July 23 event are consistent with the general picture of nonthermal electrons at energies of many hundreds of keV radiating at radio wavelengths as they travel along the coronal portion of the loop and 100–150 keV HXR when they strike the chromosphere at the footpoints of magnetic field lines.
The paper states nothoing about the electron densities (high or not) below the chromosphere.

Michael Mozina -
Where do you think that the corona is?
Where do you think the chromosphere is?

If your answer is not 1000's of km higher than the photosphere and even more 1000's of kms higher than your impossible, hypothetical solid iron surface then where have all of the scientist gone wrong?
 
...usual dumb questions...
Since you are too lazy to do your own researsh, start with Wikipedia
Corona
Light from the corona comes from three primary sources, which are called by different names although all of them share the same volume of space. The K-corona (K for kontinuierlich, "continuous" in German) is created by sunlight scattering off free electrons; Doppler broadening of the reflected photospheric absorption lines completely obscures them, giving the spectral appearance of a continuum with no absorption lines. The F-corona (F for Fraunhofer) is created by sunlight bouncing off dust particles, and is observable because its light contains the Fraunhofer absorption lines that are seen in raw sunlight; the F-corona extends to very high elongation angles from the Sun, where it is called the Zodiacal light. The E-corona (E for emission) is due to spectral emission lines produced by ions that are present in the coronal plasma; it may be observed in broad or forbidden or hot spectral emission lines and is the main source of information about the corona's composition.

Otherwise buy the textbooks or attend the university courses that you obviously have not.
 
I do not need to comment on the high density of electrons.

You don't seem to have the "need" to explain or comment on anything. :) Why is that?

I read the paper and noticed the important part as stated in the conclusion (which you have ignored - I guess GeeMack would get a million dollars in the JREF Challenge!)

The paper states nothoing about the electron densities (high or not) below the chromosphere.

So how about the electron densities in the chromosphere and corona? Where did those electrons come from?

You seem to be missing a key point. There is no guarantee that every single wavelength will show the bases of the loops terminating at the same location. The base of the loops in the x-ray band is significantly higher in the atmosphere than the base of the loops seen in the 171A spectrum. If in fact these authors are correct, then the radio spectrum penetrates perhaps as far as the x-rays, but not as far as the 171A wavelength. So what? The whole loop if filed with flowing electrons and you seem to have completely ignored that point. Even if they are 100% accurate (and I assume they are by the way) in their placement of the bases they can observe in the radio spectrum, it does not mean that loops are limited to what they observe in the radio spectrum, just as it is not limited by what we observe in the x-ray spectrum. What's the big deal?

How about those electrons? Where did they originate? Where are they going?
 
Here's that article on the activity in a comet tail that I was talking about earlier David.

http://www.sciencedaily.com/releases/2007/10/071001165932.htm

For the first time at a comet, researchers detected O3+ oxygen ions (atoms of oxygen with a positive charge because they have five electrons instead of eight). This suggests that the solar wind ions, originally missing most of their electrons, picked up some of their missing electrons when they passed through McNaught's atmosphere. The comet served as a source of electrons, said Michael Combi, a U-M space science professor who is an author of the paper.

SWICS also found that even at 160 million miles from the comet's nucleus, the tail had slowed the solar wind to half its normal speed. The solar wind would usually be about 435 miles per second at that distance from the sun, but inside the comet's ion tail, it was less than 249 miles per second.
 
mossyohkoh.jpg


RC....

The visible "bases" of the loops are *CERTAINLY NOT THE SAME* in the x-ray spectrum as they are in the iron ion wavelengths. Why would you find it the least bit objectionable or surprising if they observed the footprints of radio wavelengths at a slightly different depth? That is not surprising nor harmful to my argument in the least. It would be as if you superimposed a third color in the image that overlayed nicely over the other two colors with a slightly different location of the base it can observe at that wavelength. It's not a big deal. It's to be expected since different wavelengths will have a different absorption rate.
 
That is impossible to answer from a running difference image since each pixel in the image represents hundreds of kilometers.


Okay, so your answer to the question of the height and depth of the features on your alleged surface is, "I don't know." By the way, how many kilometers does each pixel represent?

I tend to be more inclined to go with the heliosiesmology data personally.


That helioseismology data that shows mass moving at thousands of kilometers per hour up, down, and laterally directly through your allegedly solid surface? I'm not so sure data which proves constantly flowing mass would be good data to use to demonstrate a solid surface, Michael. But your complete lack of contact with scientific reality never ceases to amaze.

Well, the quantitative methods of analyzing the location of the crust are spelled out in Kosovichev's paper. The qualitative (interpretative) process is spelled out (qualified) by Birkeland's series of controlled experiments and the other key satellite imagery like the RD images, the Doppler images and that composite TRACE/Yohkoh image.


But you aren't well versed enough in any of that material to actually point out where it specifies a solid surface? And you can't actually use the numbers from that material to say how high the mountains are or how deep the valleys are, or what sorts of temperature and density characteristics the surface has. Okay, so you don't know a darn thing about your alleged surface. Got it.

Were it not for heliosiesmology findings of a "stratification subsurface" that changes over time, you might have a point. Since that is not the case, we're going to have to debate the merits of all "interpretations" of the data sets, all the images and the various findings.


Oh, wait, you do know something about your alleged surface. It's an ever changing "solid" which actually has the properties of flowing mass, very unlike any solid that anyone has ever seen before. In fact, flowing at thousands of kilometers per hour, sort of like, well, like it can't possibly be solid by any conventional definition! Okay, it's good to know you actually acknowledge that much.

I can only image how frightened you must be if you still feel the need to insert pointless and childish name calling into every post. You must be pretty desperate.


Oh, I'm not frightened or desperate. I don't have a dog in this race. You've made an idiotic claim that you've been utterly unable to support even after several years of trying. My claim is only that you are not able to support your claim. And so far you've proven me right at every turn of the bend. You chose to take on the mainstream, Michael, not I. You could have kept your fantasy to yourself, but you didn't, and the result is you've set yourself up for public ridicule. You reap what you sow.

As much as anything I enjoy pointing out, just in case anyone loses track through all your crying and your hissy fits, how ludicrous it is that you can't, in fact, offer a detailed, specific, and quantitative analysis of that very first image on your web site. :)
 
Status
Not open for further replies.

Back
Top Bottom