• Security incident: ISF was recently accessed by intruders. Please change your password, and change it anywhere else you used it. Read more

Global warming discussion IV

Status
Not open for further replies.
Tamino's "bet"

https://tamino.wordpress.com/2016/09/02/you-bet/

Back in 2008 the deniers were on a kick about "no warming since 2001". I don't know if he had any actual takers on it but Tamino set up the conditions for a bet on wether warming would continue on the pace it had since 1975 or stop at 2001 levels. Provisionally at least, still warming has won.
 
Early-onset spring models may indicate 'nightmare' for ag

http://www.eurekalert.org/pub_releases/2016-09/cu-esm090216.php
ITHACA, N.Y. - Warm springs in the Great Lakes and Northeast regions - which create havoc for agriculture - may start earlier by mid-century if greenhouse gas emissions are not reduced, according to a new Cornell University study published in Climate Dynamics.

Very warm springs have been anomalies, but this new analysis of climate model data shows an increased frequency to nearly one in every three years by the end of this century.

"The spring of 2012, with its summerlike warmth, brought plants out of dormancy and then had a lengthy freeze. This was a nightmare scenario for many growers, and it showed us a snapshot of what global warming might look like in this region," said Toby Ault, assistant professor in earth and atmospheric sciences at Cornell University, an author on the study.

Unusually warm temperatures early in spring 2012 led to the warmest March, breaking records in more than 15,000 U.S. sites.

Modeling shows that frequency and magnitude of early springs could occur more than a month earlier, for example, throughout the Great Lakes region by 2080.

"The time to act on curbing greenhouse gas emissions is now. If we don't, years like 2012 - ruinous to farmers and producers - in the U.S. could become normal by 30 to 40 years from now in addition to a host of other impacts," said Ault...

It is not so much about the extremes, as it is the generalized and sporadic systemic disruptions.
 
To the ends of the earth

Larsen C Ice Shelf Experiencing Above-Freezing Temperatures in Winter

Along the coast of Ellsworth Land, temperatures have risen to near the thawing point (0 degrees C), in winter, in a region that typically sees -2 to -3 C readings during summer. Temperatures that are 15 to 23 C above average (27 to 40 F) now range all over the Antarctic Peninsula and nearby areas of West Antarctica. Perhaps most dramatic are the 1.5 C readings coming from sections of the C region of the Larsen Ice Shelf bordering the Weddell Sea. There, downslope hurricane-force winds howling over the shelf are helping to spike local temperatures even as sea ice in the Weddell is splintered and shoved away from the Larsen C edge.

https://robertscribbler.com/2016/09...uator-change-west-antarctic-winter-to-summer/

lot of heat still wreaking havoc hither and yon....Laresen C is the size of Scotland ...and there is a big crack in it.

Hermine still threatens to spin back up to hurricane status as the water off NJ is crazy hot for the time of year. That storm, like Sandy is a case study for the disconnect between wind speed and the amount of flooding and even the the size of the storm surge.

hermine0903.jpg


http://fivethirtyeight.com/features/we-havent-seen-many-storms-like-hermine/
 
Last edited:
And we're back to cherrypicking and carefully presented data to convey the notion something extraordinary is going on.

About Antarctica:

Argentine Base San Martín, the southernmost among those next to the Larsen Ice Shelf, had a high temperature of 3.6°C last Saturday at midnight -North winds 40 mph-. The record high for September is about 10°C and 7°C for July.

In fact Chilean Base O'Higgins, the northernmost among those next to Larsen, has had its ever registered record high of 14°C some years ago ... during September.

All this silly ado comes from not knowing Antarctica from a climatological point of view. Yes, the planet is warming, but such hand waving is not the harbinger of its destruction.

About Hermine, it's a tropical storm now and even in the unlikely event it surpasses the technical limit of 73 mph, it's very unlikely that the coastal winds are going to reach 45 mph.

I would exert caution linking things like this. When it's offering a famous temperature anomaly chart obtained by (mis)using a famous weather forecast model and it forecasts a NH 0.63°C hotter than normal, a SH 1.54°C hotter than normal but a whole planet just 0.44°C hotter than normal.

Cherrypicking. We're back to a nasty chain of cherrypicking.
 
To prevent silly replies, those who think that the NCEP/EMC HWRF model for global tropical cyclones is pretty accurate and that the National Hurricane Center knows their trade, you can take a look to the model projections for Hermine in the graphic rich website of my ""relative"" Levi Cowan, tropicaltidbits.com: Using the --> you can see Hermine debilitating and gaining force again as it crosses the Atlantic towards Europe.

Now, the winds in Nantucket -the most exposed place- are 39 mph. An important deal of rain and wind for New England and three Atlantic Canadian provinces though.
 
Global temperatures could rise 1.5 degrees by 2020, researchers say

Global temperatures could rise 1.5 degrees in the next five years, much faster than previously thought, according to new modelling.

A landmark climate deal struck in Paris last year saw almost 200 countries agree to work to limit temperature rises to "well below two degrees" and work towards limiting the increase to 1.5 degrees.

University of Queensland solar and biofuels expert Professor Ben Hankamer.

But findings from Queensland researchers published on Thursday predicted that barrier would be reached by 2020 if the status quo was maintained.

The Intergovernmental Panel on Climate Change predicted a global mean surface temperature rise of 0.3°C to 0.7°C from 2016 to 2035 in its 2014 report.

more

http://www.smh.com.au/environment/c...-by-2020-researchers-say-20160309-gneyhn.html

paper
http://journals.plos.org/plosone/article?id=10.1371/journal.pone.0149406
 
Maybe Robert Scribbler was on to something - he was getting criticized over this article
https://robertscribbler.com/2016/06...recked-jet-stream-now-runs-from-pole-to-pole/

now it seems something is afoot.

A strange thing happened in the stratosphere
A 60-year pattern in the stratosphere changes up

Date:
September 2, 2016
Source:
NASA/Goddard Space Flight Center
Summary:
High above Earth's tropics, a pattern of winds changed recently in a way that scientists had never seen in more than 60 years of consistent measurements.

A predictable pattern of winds in the stratosphere recently changed in a way scientists had not seen in more than 60 years of record-keeping.
Credit: NASA
This disruption to the wind pattern -- called the "quasi-biennial oscillation" -- did not have any immediate impact on weather or climate as we experience it on Earth's surface. But it does raise interesting questions for the NASA scientists who observed it: If a pattern holds for six decades and then suddenly changes, what caused that to happen? Will it happen again? What effects might it have?

"The quasi-biennial oscillation is the stratosphere's Old Faithful," said Paul Newman, Chief Scientist for Earth Sciences at NASA's Goddard Space Flight Center, Greenbelt, Maryland, and lead author on a new paper about the event published online in Geophysical Research Letters. "If Old Faithful stopped for a day, you'd begin to wonder about what was happening under the ground."

Winds in the tropical stratosphere, an atmospheric layer that extends from about 10 to 30 miles above Earth's surface, circulate the planet in alternating easterly and westerly directions over roughly a two-year period. Westerly winds develop at the top of the stratosphere, and gradually descend to the bottom, about 10 miles above the surface while at the same time being replaced by a layer of easterly winds above them. In turn, the easterlies descend and are replaced by westerlies.

This pattern repeats every 28 months. In the 1960s scientists coined it the "quasi-biennial oscillation." The record of these measurements, made by weather balloons released in the tropics at various points around the globe, dates to 1953.

The pattern never changed -- until late 2015. As the year came to a close, winds from the west neared the end of their typical descent. The regular pattern held that weaker easterly winds would soon replace them. But then the westerlies appeared to move upwards and block the downward movement of the easterlies. This new pattern held for nearly half a year, and by July 2016 the old regime seemed to resume.

"It's really interesting when nature throws us a curveball," Newman said.

The quasi-biennial oscillation has a wide influence on stratospheric conditions. The amount of ozone at the equator changes by 10 percent between the peaks of the easterly and westerly phases, while the oscillation also has an impact on levels of polar ozone depletion.

With this disruption now documented, Newman and colleagues are currently focused on studying both its causes and potential implications. They have two hypotheses for what could have triggered it -- the particularly strong El Niño in 2015-16 or the long-term trend of rising global temperatures. Newman said the scientists are conducting further research now to figure out if the event was a "black swan," a once-in-a-generation event, or a "canary in the coal mine," a shift with unforeseen circumstances, caused by climate change.
https://www.sciencedaily.com/releases/2016/09/160902142132.htm
 

I've seen reputable studies indicating that current emission trends could easily bring us to pass 2.0C within the next few decades, and 3.0C by 2060. It starts getting really ugly after that. I try not to be that pessimistic, but after seeing how oblivious the general population is about such issues (in their daily routines and public policy preferences and choices), it is difficult not to consider and plan for a time in the approaching decades where life becomes dramatically different than anything seen on our planet in 10s of millions of years. An extreme bottleneck event is a very real potential, avoiding it depends upon us actually being sapiens sapiens, instead of that winding up being merely a sadly ironic, self-chiseled epitaph.

Reference:

http://www.nature.com/ngeo/journal/v5/n4/full/ngeo1430.html
 
Last edited:
http://xkcd.com/1732/

[qimg]http://imgs.xkcd.com/comics/earth_temperature_timeline.png[/qimg]

LOL, I was, coincidentally, just looking at that!
And discussing it with my brother, or rather, at my brother..., what can I say, I think my little sister dropped him on his head too many times when he was very young.
:)
 
no El Nino

NASA Analysis Finds August 2016 Another Record Month
Posted Sep. 12, 2016

August 2016 was the warmest August in 136 years of modern record-keeping, according to a monthly analysis of global temperatures by scientists at NASA's Goddard Institute for Space Studies (GISS) in New York.


http://data.giss.nasa.gov/gistemp/news/20160912/

•••

I wonder if cyclonic storms have a measurable impact by pumping heat high up in the atmosphere - anyone seen an infra-red signature from a big cyclonic storm??
 
Last edited:
...I wonder if cyclonic storms have a measurable impact by pumping heat high up in the atmosphere - anyone seen an infra-red signature from a big cyclonic storm??

It's difficult to find a good sat. picture that shows the heat bump above an active hurricane, but you know such exists from the heat in the eye near the eye wall, which should be mostly updraft currents.

http://cimss.ssec.wisc.edu/goes/blog/archives/date/2015/10

(iR hurricane images aplenty about mid-page and down)

But if anything I would think a lot of hurricanes would mean cooler temps in general over month long spans, because they tend to redistribute surface heat to the upper atmosphere where it can radiate to space more efficiently, and they provide a lot of high level cloud tops that reflect solar radiation a lot better than cloudless sea surfaces. But I haven't really looked at the net heat in detail in such situations.
 
Last edited:
That's what I think as well....that it should cool things by both churning surface water ( no net loss but lower readings ) and radiating out the top.( good net loss )
...fewer hurricanes in the Atlantic basin might be playing a role as well tho the Pacific is cranking the cyclones out something fierce....Taiwan hit with two in a few days.

No La Nina ....

This may be the culprit....

HAS THE PACIFIC BLOB DELAYED LA NIÑA?
Date: 13/09/16 David Whitehouse, Science Editor
The Pacific Blob’s contribution to the record global temperatures is significant. Is it also delaying the La Niña?
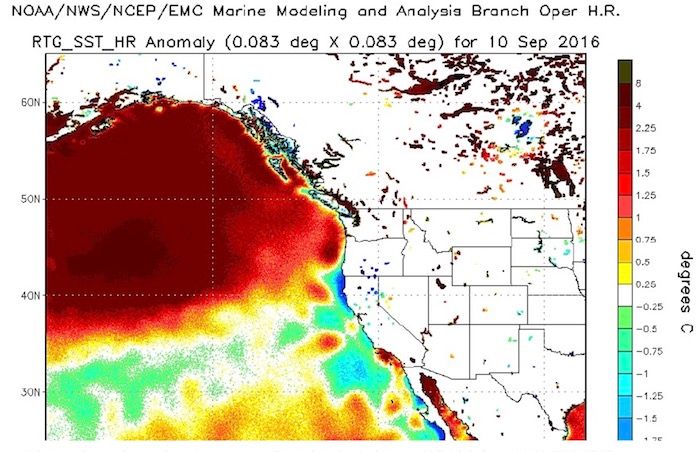


In most of the discussions about the factors behind the record-breaking global temperature of 2015 and probably 2016, the crucial contribution made by an intense El Niño is often mentioned, though not as often as it should be. Mentioned even less is the so-called Pacific “blob.” According to researchers writing in the journal Nature, “Between the winters of 2013/14 and 2014/15 during the strong North American drought, the northeast Pacific experienced the largest maritime heatwave ever recorded.” The blob’s contribution to the record global temperatures is significant.

It formed in the Gulf of Alaska during the autumn of 2013. The following year it had spread across the North Pacific to the Oyashio, Sea of Okhotsk, the Bering Sea, and to the waters offshore of the California Current. In February and June of 2014, the Gulf of Alaska had temperature anomalies of +2 to +4°C to depths of 100 m; the western North Pacific warmed an equal amount during the summer of 2014. During that summer its effects began to diminish, but it remained a prominent feature in the Northeast Pacific. In mid-September northerly winds ceased and the blob moved into the shelf waters off southern British Columbia, Washington and Oregon, raising coastal sea surface temperatures by 6°C. In November of 2014, it was entrenched in coastal waters off Oregon. The blob continued throughout the summer and autumn of 2015.

By December of 2015 many considered the blob had dissipated; By then the El Niño was intense. But the latest measurements indicate that the blob has not gone away and is currently resting several hundred metres below the ocean’s surface. The new data indicates that the region’s upper waters are being mixed by the wind again and coming back to normal temperatures, but the residual effect of the blob is still there at about 150 to 200 metres below the surface.

The reason why the blob was declared dead at the end of 2015 was that satellite thermal images no longer detected abnormally warm waters on the surface of the Pacific Coast. However, the imaging only reached up to 40 metres below the surface. The most recent vertical measurements suggest that the blob might be starting to weaken at the new depth.

Delayed La Niña
Many scientists expected that in the next few months a La Niña – an ocean-atmospheric system that has a cooling effect on surface temperatures – would bring temperatures back to normal. When the expected region of cold water started to breach the surface last May, ending the El Niño’s reign, climatologists forecasted a 75 percent chance La Niña would be here by the end of the year. But recently NOAA’s Climate Prediction Center changed its mind and is now predicting neutral conditions persisting through the forthcoming winter. The probability of a La Niña has been downgraded significantly to about 40 percent.

The delayed La Niña will obviously affect global temperatures keeping the globe warmer for longer. Despite the ending of the El Niño and subsequent cooling 2016 was already on course to be a record because of the strength of the El Niño’s contribution.

NOAA’s next updated long range 30- and 90-day forecasts, are due out on September 22nd. It will be fascinating to see if the blob is a factor in predictions and its interaction with the missing La Niña.

http://www.thegwpf.com/has-the-pacific-blob-delayed-la-nina/

Y'know that blob has to be having some impact across the Arctic Ocean....hard to tease it out in this paper but didn't the Barent's Sea biome switch from Arctic to Northern Pacific in the last decade???

Arctic Ocean outflow shelves in the changing Arctic: A review and perspectives

Christine Michela, , , Jim Hamiltonb, Edmond Hansenc, David Barberd, Marit Reigstade, John Iacozzad, Lena Seuthee, Andrea
Highlights
•
Arctic outflow shelves are undergoing major hydrological and cryospheric changes.
•
The Arctic outflow shelves respond differently to climate and ecosystem forcings.
•
Model scenarios identify current and future productivity regimes.
•
The contribution of outflow shelves to Arctic primary production is underestimated.

http://www.sciencedirect.com/science/article/pii/S0079661115001871
 
Last edited:
snip

warmest-august-in-136-years.gif

(August 2016 was the hottest month on Earth in all of the past 136 years. Though the Earth is cooling into fall, September 2016 looks like it will be the hottest September ever recorded. Overall, 2016 is on track to be the hottest year on record by a significant margin. Image source: Earth Observatory.)

Temperatures in these ranges would represent the hottest September on record by a pretty big margin (about 0.13 C globally). Meanwhile, the annual averages for the first nine months of the year would hit near 1.27 C above 1880s averages if the NASA measure saw a warming similar to that showing up in Stokes’s early NCEP/NCAR reanalysis figures — a measure disturbingly close to the 1.5 C departure levels that represent the first major global climate threshold, a level that many scientists have advised us we’d be wise to avoid.

no El Nino tho certainly residual heat.

from the longer article

https://robertscribbler.files.wordpress.com/2016/10/warmest-august-in-136-years.gif?w=1154&h=642

Planet at its hottest in 115,000 years thanks to climate change, experts say
Global warming is said to be bringing temperatures last seen during an interglacial era, when sea level was 6-9 meters (20-30ft) higher than today
Oliver Milman in New York
@olliemilman
Tuesday 4 October 2016 15.00 AEDT Last modified on Tuesday 4 October 2016 15.56 AEDT

The global temperature has increased to a level not seen for 115,000 years, requiring daunting technological advances that will cost the coming generations hundreds of trillions of dollars, according to the scientist widely credited with bringing climate change to the public’s attention.

A new paper submitted by James Hansen, a former senior Nasa climate scientist, and 11 other experts states that the 2016 temperature is likely to be 1.25C above pre-industrial times, following a warming trend where the world has heated up at a rate of 0.18C per decade over the past 45 years.

This rate of warming is bringing Earth in line with temperatures last seen in the Eemian period, an interglacial era ending 115,000 years ago when there was much less ice and the sea level was 6-9 meters (20-30ft) higher than today.

In order to meet targets set at last year’s Paris climate accord to avoid runaway climate change, “massive CO2 extraction” costing an eye-watering $104tn to $570tn will be required over the coming century with “large risks and uncertain feasibility” as to its success, the paper states.

https://www.theguardian.com/environ...mperature-climate-change-highest-115000-years
 
Last edited:
The Paris Climate Agreement Is Now Official

The historic deal to address climate change will enter into force in 30 days.


73 countries (57% of global emissions) already ratified it.

Particularly with respect to the fatally flawed Paris Climate Agreement, don't you find the phrase "enter into force" at the least somewhat ironic?
 
Aren't we already past 1.5 C? :D :boxedin: :rolleyes:

then there is the Dumpf :mad:

Some good progress on potential large scale CO2 pull down tho ...I wonder what the name is for peak CO2 emissions....do we need to name a new curve.??
 
Status
Not open for further replies.

ISF - Join now!

Every member here is approved by hand. No bots, no spam, just people who care about evidence and honest debate.

Membership is free!

Create your free account

Back
Top Bottom