• Security incident: ISF was recently accessed by intruders. Please change your password, and change it anywhere else you used it. Read more

Global warming discussion IV

Status
Not open for further replies.
OK, now this is going to look a bit weird, because this forum doesn't allow nested quotes

You can. You just need to craft your way.

Now given that this forum doesn't allow newbs to post links, this is again, a somewhat unnecessarily annoying task, but Macdoc's claim was that it was nonsense that the IPCC FAR projected 1.4C of warming over pre-industrial by 2016. If you use your Google-fu to rustle up a pdf copy of the complete FAR in the IPCC website, and go to page 31,

For newbies, you have to break them this way:

http:
//
www
.
ipcc.
ch/ipccreports/far/
wg_I/ipcc_far_wg_I_full_report.pdf

what copied and pasted in your browser works just fine by pressing enter.

About that limitation here, it is lifted sooner than later (not allowed to say exactly when)

If you were talking about that document, did you mean pages XXII to XXIV? (I love the archeologic figure 6.11 in page 190, like everything was gotten using an endless provision of punched cards in FORTRAN).

If you don't mind me telling, you'll save a lot of debate if you spot the one debater around who has held a wrong understanding of climate sensitivity for years. I mean, his static conceptualization is quite OK though he tends to favour old papers, but his understanding of its onset can't be fuzzier, hence that constant erring on the side of cry-wolf. And I'm not meaning Trakar who is sharp and good people.
 
Meh. No real interest in trying to figure out who really took what position in some other forum. Even if that was the position taken maybe it evolved. It’s much better just to state your current position here and move on from there.
 
IPCC projection got to 1.5C on the extreme range circa 2042 ish.

a bit off the mark.

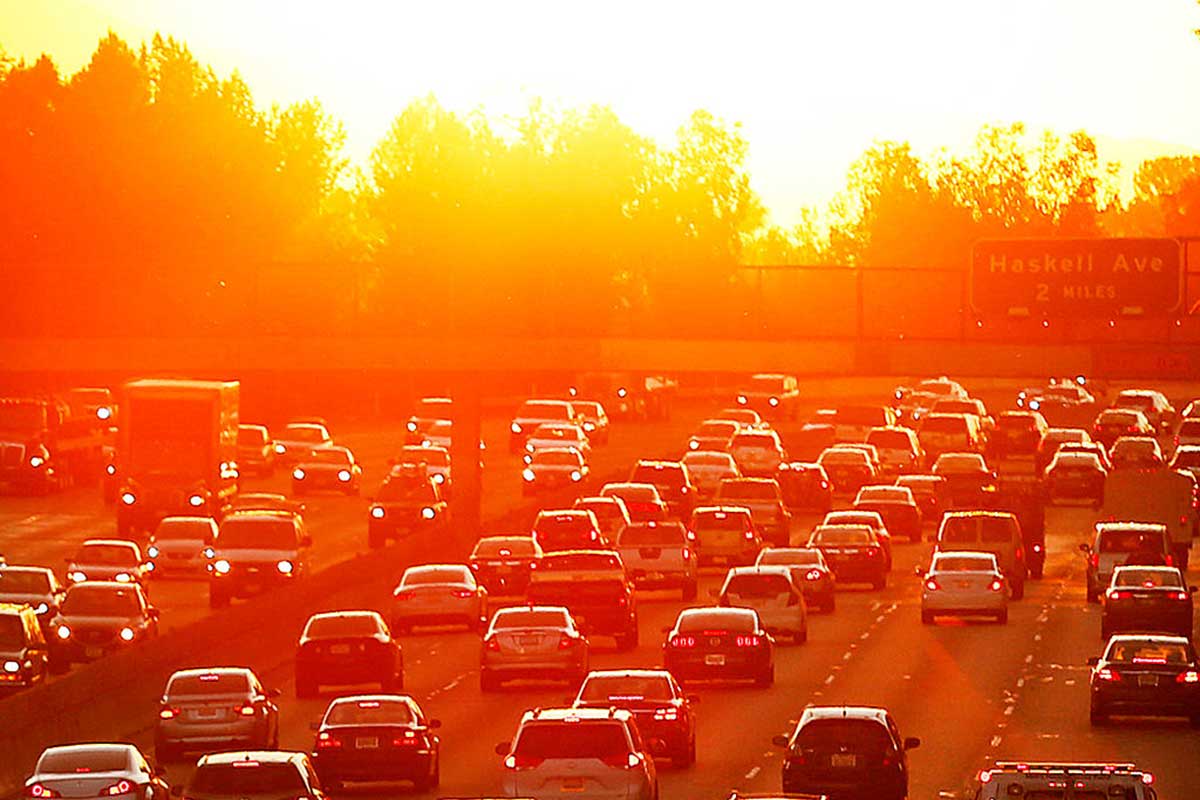
Unprecedented global warming as 2016 approaches 1.5 °C mark

gettyimages-500468112.jpg


Jam of cars going both ways on a five-lane highway in LA, with the sun in the background making everything glow and giving an aura of hot, hot, hotness
Feeling the heat
Al Seib/Los Angeles Times via Getty Images
By Michael le Page

[color=#FF0000[HILITE]]Global surface temperatures could get close to the 1.5 °C-above-preindustrial limit before the Paris climate agreement even comes into effect[/HILITE][/color].

That’s alarming news, considering that the deal aspires to limit global warming to no more than this.

Last week Gavin Schmidt, head of NASA’s Goddard Institute of Space Studies, estimated that the average global temperature in 2016 could range from about 1.1 °C above preindustrial to only slightly below 1.5 °C, based on GISS’s temperature record and its definition of pre-industrial (other records and definitions vary).

https://www.newscientist.com/articl...global-warming-as-2016-approaches-1-5-c-mark/
 
If you don't mind me telling, you'll save a lot of debate if you spot the one debater around who has held a wrong understanding of climate sensitivity for years. I mean, his static conceptualization is quite OK though he tends to favour old papers, but his understanding of its onset can't be fuzzier, hence that constant erring on the side of cry-wolf. And I'm not meaning Trakar who is sharp and good people.
Thanks for that (and you earlier, longer precis of the state of things here, which is much as it is where I usually am, for much the same reasons).

Meh. No real interest in trying to figure out who really took what position in some other forum. Even if that was the position taken maybe it evolved. It’s much better just to state your current position here and move on from there.
No, me either, and apologies again for taking up space with it. My position is also that I don't like importing stuff from elsewhere, but when I stumbled on the fact that it had been, I just wanted to set some things straight to the person importing it. It was (knowingly) somewhat rude to those who had no clue what was going on (and it's certainly not worth finding out). I'm certainly not going to bring it up again.
 
My original statement that Macdoc took exception to was:
A more pertinent issue with your original statement and macdoc's response would be the plural used in "first IPCC report's projections from 1990". The 1990 FAR report had 4 projections based on 4 emission scenarios. You both needed to pick an emission scenario to get a projection otherwise all we can say is the this year's temperatures lie within a wide range of projections from the 1990 report.

The Lessons from Past Climate Predictions: IPCC FAR post from 2011 on Skeptical Science notes that the "Business As Usual" scenario leads to predicted temperatures above the measured temperatures from 1970 to about 2010. They then update the 1990 FAR projections with observed GHG emissions and the predictions match the measurements- once again up to about 2010.
 
Last edited:
4756594270_38cce33932_m.jpg
:rolleyes:
•••••

Excellent longish article about the Greenland Ice Sheet.
Interesting in particular that we are CO2 PPM near to when it first formed during the Middle Miocene.

snip
Conditions in Context — The Level of Atmospheric Greenhouse Gasses is Now About Equal to Where They Were When the Greenland Ice Sheet First Formed

complete article

NASA Map Shows Large Portions of Greenland are Melting from Below
During recent years, as human fossil-fuel emissions have forced the Earth to warm, observations of Greenland’s surface has indicated a rising rate of melt. What has been less well-observed is melt rates beneath the ice and near the ice base. This is important because the pooling of water beneath the great ice sheet can help speed its movement toward ocean outlets, along with accumulating heat at the base of the ice — which can also quicken the pace of overall melt.

A new scientific study headed by NASA researchers has developed one of the first comprehensive maps of melt along Greenland’s basal zone, where the ice contacts the ground surface. What they have found is that large portions of Greenland are melting from below:
greenland-basal-thaw-map.jpg


(New, first-of-its-kind map shows extensive melt along the Greenland ice sheet base. Melt in this region is a sign that heat is building up beneath the ice as well as on top. Image source: NASA.)

continues
https://robertscribbler.com/2016/08...portions-of-greenland-are-melting-from-below/
 
A more pertinent issue with your original statement and macdoc's response would be the plural used in "first IPCC report's projections from 1990". The 1990 FAR report had 4 projections based on 4 emission scenarios. You both needed to pick an emission scenario to get a projection otherwise all we can say is the this year's temperatures lie within a wide range of projections from the 1990 report.

The Lessons from Past Climate Predictions: IPCC FAR post from 2011 on Skeptical Science notes that the "Business As Usual" scenario leads to predicted temperatures above the measured temperatures from 1970 to about 2010. They then update the 1990 FAR projections with observed GHG emissions and the predictions match the measurements- once again up to about 2010.
Sure, that's reasonable. What I was getting at was that given the models' performance using actual emissions, there's no need to trash the model based on current observed temperatures. Macdoc, to be fair, did indirectly specify an emissions scenario - he claimed we're over a decade ahead of all IPCC scenarios, as he's insinuating again here, by juxtaposing a report that we're close to 1.5C above pre-industrial temperatures now with this:

IPCC projection got to 1.5C on the extreme range circa 2042 ish.

a bit off the mark.
I'm not going to get into this here, other than to encourage skepticism of this claim about the IPCC's projections of warming over pre-industrial temperatures.
 
--snip--
OK, now this is going to look a bit weird, because this forum doesn't allow nested quotes
--snip--
I am not commenting on the thread topic as I follow the thread as an interested but uninformed layman, but I can tell you how to do what you want without it being too difficult.

Go to the post you want to quote and click on the name of the person who posted it over in the left sidebar. On the dropdown list that will appear, click on "Quote this message in a pm to Poster."

When you do that, the entire post will be in a pm box, formatted for all the required nesting. Highlight the whole thing and copy it.

Then use your back button to get back to the thread and scroll down to the Reply box. Paste what you copied in there then write your comments below it.

===

Alternatively, if you want to quote several posts in one reply, then go to the first you want to quote and rather than clicking the Quote button click the button with the quotation marks. Then scroll to the next and do the same thing and so on. When you get to the final post you want to include in your reply, hit the Quote button on that one and only that one.

Hope that helps.
 
Anyway, nice to meet you all - there's some interesting discussion here, but I'm too busy to contribute to multiple fora at present. I may, however keep an eye on this thread to see if what I've written elsewhere recurs as a subject.

Apologies to those who have no idea what this is about, but Macdoc has imported a disagreement between the two of us elsewhere to this forum, and while I'm able to address his misrepresentations here, I don't yet have enough posts to link to the original context for this discussion, so for now, I've got little more to say than some straightening of the record for his benefit, and that of anyone who may have read his rather idiosyncratic take on our exchange that he posted here.


I wanted to pop in and give a big welcome to you OlivierK. Thanks for adding your knowledge here. You might want to avoid some other subsections of this forum as skepticism goes completely out the door there (politics anyone?). :D
 
...Got something which includes and reflects the last 5-6 years of data and understanding?...(slightly edited to better reflect original usage)
How does that relate with what the IPCC's 1990 FAR projected?

Well, I'm assuming that the graphs presented earlier used standard "best practice" of smoothing and averaging over time. FAR projections are still in our future, any accurate comparison should look at the full range of FAR projections with an included line for the author's "most likely" scenario and the full scope of temperatures between when the projections were made and the present.

Again, the graphs you linked were designed in 2011 to demonstrate that 1990 (actually 1980s) models were producing projections that were ballpark good enough to base short/mid-range public policy decisions upon (a position I agree with), not to determine whether or not the scientists (much less the politicians who actually produce public policy) have been surprised by the speed and strength with which climate has been changing over the last quarter century or so.

Which to my understanding is at the root of the issues between MacDoc and our new guest, and the topic being addressed.
 
My position, on the matters on which you passed judgement to Macdoc here - (so I presumed you wouldn't need it explained) is that Macdoc's claim (that current temperatures are decades in advance of the 1990 FAR's worst case projections) is not substantiable.

Allow me to interject.

I deal with discussion issues as they are presented for discussion. Whether I agree or disagree with a poster is almost entirely dependent upon the content of their post/discussion, not by who posted something or even by whether or not I have agreed or disagreed with them in the past. I doubt there is a person here who I have not agreed, or disagreed, with at one time or another.

I ask you to state/clarify and expound upon your positions, here in this forum, precisely so that we can dispense with the problems of misattribution and argument by hearsay issues.

I could be petty and say that the burden of proof is entirely on Macdoc to substantiate his claim, and given that he's made no effort to do so, I remain skeptical on that basis alone.

I would agree, with this statement, but MacDoc did not make that statement here, so again, it is an issue of hearsay, which distracts from the discussion here. That is why I want to get both sides to clearly restate their positions and understandings so that they can be properly addressed and discussed here, in this forum.

(snip of issues being discussed with Alex in sub-thread) Once I've got enough posts to post links, I can link you to where I walked Macdoc through how to do so...

That might be of help as a reference for your previous discussion elsewhere with MacDoc, but for the sake of discussion here, a simple summary of your explanation that we can use as a jumping off point for more detailed exploration and discussion here, would be much more relevant to our present discussion.

(snippage of largely irrelevant other forum hearsay - (which may or may not be accurate - but is still irrelevant to discussions in this forum))
Outside this rather arcane dispute over easily-looked-up-specifics, my views on climate change are similar to Macdoc's - that current and likely future emissions have caused, and will continue to cause, warming with serious impacts which insufficient action is being taken to ameliorate. He's just got a bee in his bonnet about me calling him out when he posts hyperbolic nonsense. Our disagreement seems to centre on whether the current temperature spike is evidence of warming that shows past modelling to have grossly underestimated warming. It would be easier to nail it down more concretely than that if he contributed more than condescension and name-calling to the discussion. You've passed comment on our discussions here, so I presume Macdoc sent you links to them. Go read them, they're still there.

Actually, no. MacDoc has not sent me links, and I likely wouldn't follow them if he did, I've little to no interest in discussions on forums that I do not already participate on. I commented here, based on information that has been presented here.

Your position on AGW seems reasonable and in accord within the range of mainstream climatology, but that doesn't mean that there is no room for discussion and disagreement within that range.

Welcome, I hope that you stick around long enough to more fully share your perspectives and understandings as well as participate in our discussions here.
 
Last edited:
My original statement that Macdoc took exception to was:
"Scientists haven't been caught out, they've simply been vindicated. These rises are in line with IPCC predictions, and are to be expected when a strong El Nino cycle is added to a rising base trend. It's a pet hate of mine that people misrepresent temperature rises that are in line with IPCC predictions as unexpected, when this year's temperature is very close to the first IPCC report's projections from 1990. To go further and say that the projections, which have been very accurate, may need to be scrapped or adjusted in response to a large short-term jump is as stupid as those who wanted to scrap the projections because of a short-term "pause". More so, even, given the shorter time frames for the observed rise."
Macdoc countered by saying that the 1.1C anomaly for April 2016 published by NOAA "was NOT in the IPCC 1990 projections" and that "we are a DECADE ahead of the IPCC worst case" which he illustrated with an unattributed chart on which he'd inaccurately drawn the current temperature anomaly. It all got a bit stupid from there, and hasn't recovered. I feel no real need to go over it here, it's been surreal and pointless enough over there. If you're interested, sign up at Ratskep where I can post links, we can nest quotes, you don't get logged out every ten minutes, and where it may be vaguely on topic.

I would largely agree with many of the statements you have made here, in the same breath, however, I do not see that MacDoc has made (according to your account) any statements I would strongly or vehemently disagree with (in quotes above).

Graphs are useful for generalized overviews of data, but for details, the actual data is more useful and projections from the models used in the '80s should not be viewed as particularly useful for any particular year. They were definitely looking at climate-relevant periods of time (the smallest being ~3 decades). Within that framework, you are both, currently and arguably in accord with the facts. Whether both of your positions hold up as we move forward, remains to be seen.

Point of Interest - How is the baseline of 0ºC in the chart on pg.31 of the FAR determined? What is the baseline used in most modern graphs?
 
Last edited:
Meh. No real interest in trying to figure out who really took what position in some other forum. Even if that was the position taken maybe it evolved. It’s much better just to state your current position here and move on from there.

:thumbsup:

especially so when the entire disagreement seems more molehillish than mountainish once all the perspective issues are properly stated and qualified.

((not that I am beyond significant pedantism when hot-button issues are breached - or I'm bored))
:)
 
A more pertinent issue with your original statement and macdoc's response would be the plural used in "first IPCC report's projections from 1990". The 1990 FAR report had 4 projections based on 4 emission scenarios. You both needed to pick an emission scenario to get a projection otherwise all we can say is the this year's temperatures lie within a wide range of projections from the 1990 report.

The Lessons from Past Climate Predictions: IPCC FAR post from 2011 on Skeptical Science notes that the "Business As Usual" scenario leads to predicted temperatures above the measured temperatures from 1970 to about 2010. They then update the 1990 FAR projections with observed GHG emissions and the predictions match the measurements- once again up to about 2010.

Agreed, and very important when viewed in conjunction with what the perspective of these projections was at the time to how this information would be received and acted upon. At least when we are trying to determine whether or not those researchers would surprised or shocked at how things have played out over the intervening 26(+)years since these projections were calculated.
 
I am not commenting on the thread topic as I follow the thread as an interested but uninformed layman, but I can tell you how to do what you want without it being too difficult.

Go to the post you want to quote and click on the name of the person who posted it over in the left sidebar. On the dropdown list that will appear, click on "Quote this message in a pm to Poster."

When you do that, the entire post will be in a pm box, formatted for all the required nesting. Highlight the whole thing and copy it.

Then use your back button to get back to the thread and scroll down to the Reply box. Paste what you copied in there then write your comments below it.

===

Alternatively, if you want to quote several posts in one reply, then go to the first you want to quote and rather than clicking the Quote button click the button with the quotation marks. Then scroll to the next and do the same thing and so on. When you get to the final post you want to include in your reply, hit the Quote button on that one and only that one.

Hope that helps.

Much easier than the method I generally use, thank-you for sharing!!
 
...

Again, the graphs you linked were designed in 2011 to demonstrate that 1990 (actually 1980s) models were producing projections that were ballpark good enough to base short/mid-range public policy decisions upon (a position I agree with), not to determine whether or not the scientists (much less the politicians who actually produce public policy) have been surprised by the speed and strength with which climate has been changing over the last quarter century or so.

Which to my understanding is at the root of the issues between MacDoc and our new guest, and the topic being addressed.

I see. I only intended to address the theme related to the misrepresentation of OlivierK's as he told and not the larger topic within such misrepresentation was happening.

About the topic of scientist being surprised by the changing climate over the last 25 years, that's subjective to say the least. I have some little story to refer, though. I'm lazy to track it back but you may find posts of mine here about two or two and a half years ago, in those times when the mythical "pause" was a presence, regarding my collaboration with a work group researching deep systemic connections in the triggering of El Niño episodes. I once wrote here "we" were getting two outputs: one that suggested a medium episode of El Niño starting soon and then easing slowly, another suggesting the false start of that episode to lately, by December, develop into a strong and prolonged episode with strong consequences.

I told that moment that a system that offers two distinct path has little use and declined to follow that up. But it happened the second path was the real one the last episode took -of course, it's easy to retell the story in hindsight and select the week it pointed to the episode as it was, and suppressing the bit telling that a pretty strong La Ñiña was going to develop later, what is still to be seen and not extremely likely now-.

I mean, that research left the participant convinced that developments east of Drake Passage are much less important than expected and the part of the "hub" (the particular profile of water temperatures at all depth around Antarctica that starts in Rio de Janeiro, gives a turn around the planet and ends at Cape Horn) in the southern Atlantic is much more important than expected -that my expectation- with Agulhas having a paramount role -what I wasn't expecting to be that strong- and other structures like Malvinas (Falklands) Current being more the canary in the coal mine than a causal path crossroads -to my dissapointment-.

I mean, there's a lot it is being learnt all the time, but there's a Darwinian aspect in all what is published and taken as correct: they're just unambiguous, and that doesn't mean they are the best. It's like using a skateboard as a mean of transportation: it won't leave you stranded, but you won't go too far.

Around all that we have a testimonial "year when things went hot", whick equals the "pause" in lack of value. We have the underlying temperature trend of +0.12 to +0.14°C per decade, which doesn't seem to be changing much until the middle of this century, and we have more spread that ever between the models that make IPCC projections. The more complex the model, the less warming it is forecasting in the mid term. That's why we don't see much of it lately. I mean, Earth system models are telling truths that propaganda and hype won't like to hear. And we need propaganda and hype to do their job to have the problem taken care of. It's pretty much like a 29 yo needed to be convinced to fund his pension plan: it has to be almost compulsory 'cause, if isn't, the youngster will find himself in misery and despair in the future, because old-age comes, whatever he thinks now. AGW works the same way. People is doing too little and some hype is needed (Macdoc goes too far frequently), but the fact is that humans set the destination through our polluting ways, while it's the system called Earth the one that decides the speed we'll arrive there. And the system isn't in a rush as the political needs in the subject may demand.

I prefer to convince the 29 y.o. guy that he'll eventually grow older and not telling him how he is dying a little every second right now just because he has this puerile fantasy of he not needing to save now because he will be able to save when he reaches 50.

 
Actually, no. MacDoc has not sent me links, and I likely wouldn't follow them if he did, I've little to no interest in discussions on forums that I do not already participate on. I commented here, based on information that has been presented here.
Ah. So despite your disdain of hearsay, you've favoured it in this instance.

When you said:
In my consideration, you have a better handle on this material and the underlying science, than he appears to. That said, his statements are largely in accord with the 20+ year old reports and mainstream science understandings he is using as references. What he doesn't seem to understand is that the evidence and the science understandings have grown and evolved over the last 20+ years and his understandings are as dated as the sources he is referencing.
I assumed that you had in fact read our discussion in order to come to your conclusion about my understandings. If not, then I really have no interest in reproducing that discussion here so that you can pass a more informed opinion on it.

The original discussion that Macdoc referenced here has been one of the more irrational discussions I've had on any subject for some time. Most of Macdoc's errors are arithmetical in nature, no better than arguing that 2+2=7, and while it's provided some amusement (of the "how many errors can a short post contain" sort) it's not an issue that I feel the need to hear people's input on.

Point of Interest - How is the baseline of 0ºC in the chart on pg.31 of the FAR determined? What is the baseline used in most modern graphs?
It's a pre-industrial baseline on the FAR graph. I know there are several, but from memory it's a 1765 estimate or some such. All the pre-industrial baselines I'm familiar with are within around 0.1C of each other, so it's not really material which they've used.

Most modern graphs either use the baseline from their chosen dataset (often 20thC average or 1951-1980 average, both around 0.4C above pre-industrial) or a recent two- or three-decade average (often around a further 0.4C higher again depending on the chosen period.)

I presume you know all that already. It's not me you need to be testing on this stuff: Macdoc's claim that the IPCC forecast 1.5C above pre-industrial no earlier than 2042 - a statement he's now repeated here - is taken from his misreading of a graph from the AR5 FAQs that shows 2042 projected using RCP8.5 as 1.5C above the 1986-2005 average used as the baseline, as if that's the same as 1.5C over pre-industrial. It's a schoolboy error, but Macdoc thinks pointing it out equates to belittling the crisis aspect of climate change.

Around all that we have a testimonial "year when things went hot", whick equals the "pause" in lack of value. We have the underlying temperature trend of +0.12 to +0.14°C per decade, which doesn't seem to be changing much until the middle of this century, and we have more spread that ever between the models that make IPCC projections. The more complex the model, the less warming it is forecasting in the mid term. That's why we don't see much of it lately.
This is very much in accord with my own views.

I mean, Earth system models are telling truths that propaganda and hype won't like to hear. And we need propaganda and hype to do their job to have the problem taken care of. It's pretty much like a 29 yo needed to be convinced to fund his pension plan: it has to be almost compulsory 'cause, if isn't, the youngster will find himself in misery and despair in the future, because old-age comes, whatever he thinks now. AGW works the same way. People is doing too little and some hype is needed (Macdoc goes too far frequently), but the fact is that humans set the destination through our polluting ways, while it's the system called Earth the one that decides the speed we'll arrive there. And the system isn't in a rush as the political needs in the subject may demand.

I prefer to convince the 29 y.o. guy that he'll eventually grow older and not telling him how he is dying a little every second right now just because he has this puerile fantasy of he not needing to save now because he will be able to save when he reaches 50.
I think that's a very astute analogy :thumbsup:
 
Ah. So despite your disdain of hearsay, you've favoured it in this instance...

No, as noted previously I gave a considered response based upon information presented on this board to one side of a story and the characterizations presented in it. Once you decided to bring your perspective and side of the discussion here, I have been open and encouraging toward you presenting your side of the discussion in your own words here on this board so that the issues which apparently have you both so emotionally engaged may be discussed directly and with a minimal of hearsay about claims and assertions made in previous discussions on other boards.

If you are uninterested in clarifying and expounding upon your discussion here, that is fine by me, but it does seem rather curious as your initial claims on this board indicated that your reason for coming here involved wondering about whether your discussion and position elsewhere had been misrepresented and mischaracterized and a personal desire to set the record straight about such issues.

Until you present your argument in your own terms there is not much to discuss with you about it. The choice about what you do and how you go about those processes is up to you...

...It's a pre-industrial baseline on the FAR graph. I know there are several, but from memory it's a 1765 estimate or some such. All the pre-industrial baselines I'm familiar with are within around 0.1C of each other, so it's not really material which they've used...

Regardless of your consideration about whether or not 0.1ºC (or 0.4ºC, or 0.8ºC) is a material, or important issue of consideration when looking at such issues, in instances such as those being discussed, this difference can be substantial.

When you are comparing very imprecise graphs and trying to subjectively estimate ("...Macdoc's claim was that it was nonsense that the IPCC FAR projected 1.4C of warming over pre-industrial by 2016. If you use your Google-fu to rustle up a pdf copy of the complete FAR in the IPCC website, and go to page 31, you'll see a chart that shows this not to be true...") temperatures that are in variance of a couple of tenths of a degree (roughly a bit more than a decade's worth of warming at current rates) then questions about whether a graph uses a different "0" start point that is a tenth of a degree different (or more), can make a big difference in such subjective analyses.

If your discussion distinctions exist only in the MoE of a subjective eyeball analysis of a very imprecisely presented graph (much less the comparisons of graphs derived from different datasets and standards - especially when the data points describing the lines in such graphs are themselves averaged values),...you might as well be arguing about the number of angels who can dance on a pinhead.
 
I see. I only intended to address the theme related to the misrepresentation of OlivierK's as he told and not the larger topic within such misrepresentation was happening...

In general (at least in all that you discuss in the above post. :) ), we have much agreement and very little disagreement. I have always appreciated your discussion, even (and occasionally "especially") when we disagree!

How is winter down your way? Summer is beating up on us right now.
 
Last edited:
How is winter down your way? Summer is beating up on us right now.

I live in the area that has had a winter colder than the new normals. We had a record-breaking 102 days in a row with temperatures not rising above 20°C (68°F) any time. That must sound a little not-wintry to you, but here, being 1200 Km far from the tropic and with plenty of ocean in the cold side and continent in the equatorial side, it's usual to have periodical incursions of warm air masses coming from Paraguay and Southern Brazil which rise temperatures up to 20-23°C for one day or two. Well, this year, instead of the usual labile weather, cold weather has been remarkably steady, though without surprises in the below zero region either.

The region north of my location has suffered torrential rains all the autumn and the wettest and muddiest winter in memory.

But spring is coming early, as it is becoming customary now. The usual weather spells that tradition had pegged with the name of the saint of the date since colonial times are forgotten now. This year, the "little Summer of Saint John" (June 24th) not only didn't come in time. It didn't come at all. And the storm of Saint Rose's Day (August 30th) already happened. It is a heavy rainfall that usually occurs when winter conditions give way to more summery weather patterns.

Maybe the news related to global warming is the costs of all of it. Only this year some eight thousand million dollars are being invested in works to control floods, rebuild routes and bridges, and relocate population. In the last 25 years and in the 15 or 20 to come, maybe some 500,000 million dollars were and will be spent in this niceties or lost during catastrophes associated with changing weather. At least a half of it, if not two thirds, would have been and would be unnecessary or not a priority should not occur this environmental catastrophe of our era. And I'm letting out the lives lost and to be lost. Because everybody knows you cannot put a value on a human life, hence they are accounted as zero in ledgers.
 
Status
Not open for further replies.

ISF - Join now!

Every member here is approved by hand. No bots, no spam, just people who care about evidence and honest debate.

Membership is free!

Create your free account

Back
Top Bottom