• Quick note - the problem with Youtube videos not embedding on the forum appears to have been fixed, thanks to ZiprHead. If you do still see problems let me know.

Global warming discussion IV

Status
Not open for further replies.
<snip>


Edited by Loss Leader: 
Edited in full for Rule 0.
 
Last edited by a moderator:
You should get the story correct instead of using misleading headlines.


Turnbull is not Abbott....

My read on it is correct. The fluff given by the CSIRO is standard corporatespeak crap. Read the ABC article in full. Major research such as Cape Grim are likely to be shut down. This isn't at all about accepting the science of AGW being correct, it is about shutting down the research. The scientists will only be deployed if they have skills required in other areas. Surprise surprise, they don't.

Turnbull is not Abbott but this is 100% Abbott's policy. Turnbull is so weak he has to implement it or upset the conservatives.
 
Last edited:
What is crap is ABCs slant.....as is your take.
NOAA and NASA and others are providing the primary modeling information. What is needed is the application of resources to adaptation and regional solutions.
Turnbull restored the CSIRO funding and is not the anti-climate change dunderhead Abbott was.

The dialogue and resources and the discussion here needs to move on from reinforcing climate change reality...that is done...to the issues dealing with that reality....an entirely different set of needs for society to put resources into.

You have a declining income base to fund science......instead of being pleased the funding was restored and you have a science positive PM - all I hear is the tired whinging. Gives credence to the ivory tower criticism.

So we may as well give Alex the sack as well, he's obviously not doing anything useful?
 
The republicans are trying to defund NASA climate research as well.

Last week, the House Science, Space, and Technology Committee, headed by Texas Republican Lamar Smith, approved a bill that would slash at least three hundred million dollars from NASA’s earth-science budget. “Earth science, of course, includes climate science,” Representative Eddie Bernice Johnson, a Texas Democrat who is also on the committee, noted. (Smith said that the White House’s NASA budget request favored the earth sciences “at the expense of the other science divisions and human and robotic space exploration.”) Johnson tried to get the cuts eliminated from the bill, but her proposed amendment was rejected. Defunding NASA’s earth-science program takes willed ignorance one giant leap further. It means that not only will climate studies be ignored; some potentially useful data won’t even be collected.

The vote brought howls of protest from NASA itself and from wider earth-science circles. The agency’s administrator, Charles Bolden, issued a statement saying that the bill “guts our Earth science program and threatens to set back generations worth of progress in better understanding our changing climate.” In an opinion piece for the Washington Post, Marshall Shepherd, a professor of atmospheric science at the University of Georgia and the former president of the American Meteorological Association, said that he could not sleep after hearing about the vote. “None of us has a ‘vacation planet’ we can go to for the weekend, so I argue that NASA’s mission to study planet Earth should be a ‘no-brainer,’ ” he wrote.

http://www.newyorker.com/news/daily-comment/gop-war-on-science-gets-worse
 
From the Repuglies I'm not the least surprised....meanwhile back to some climate science...

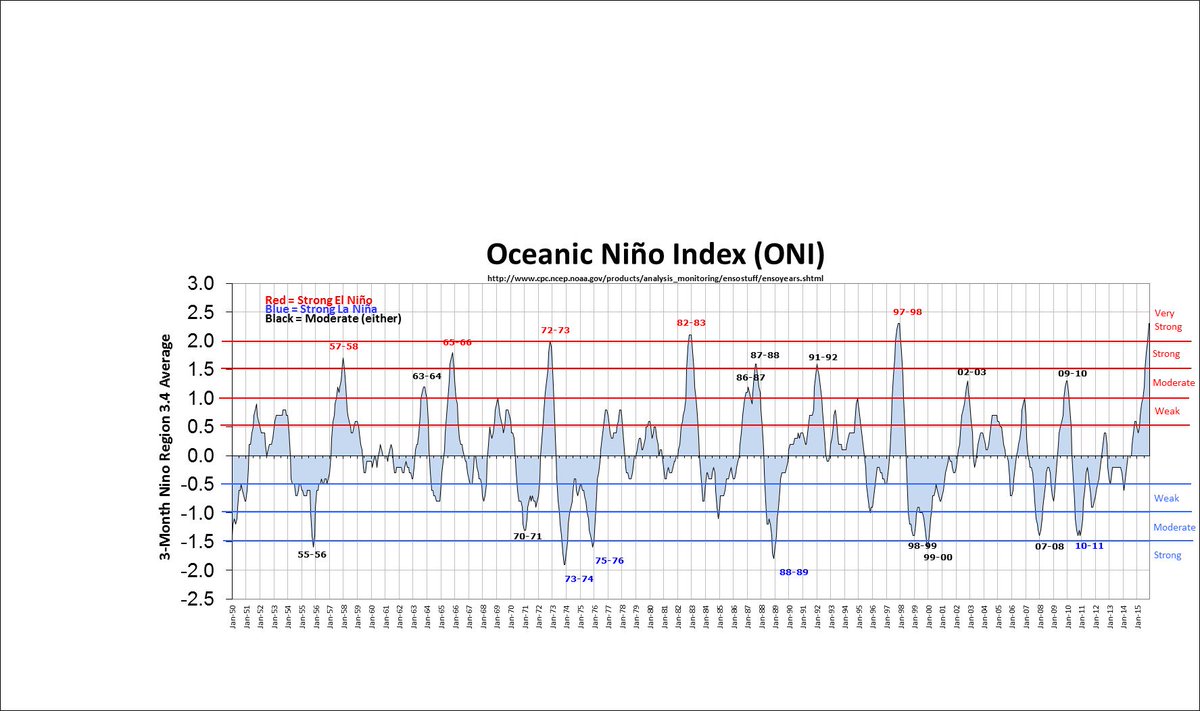
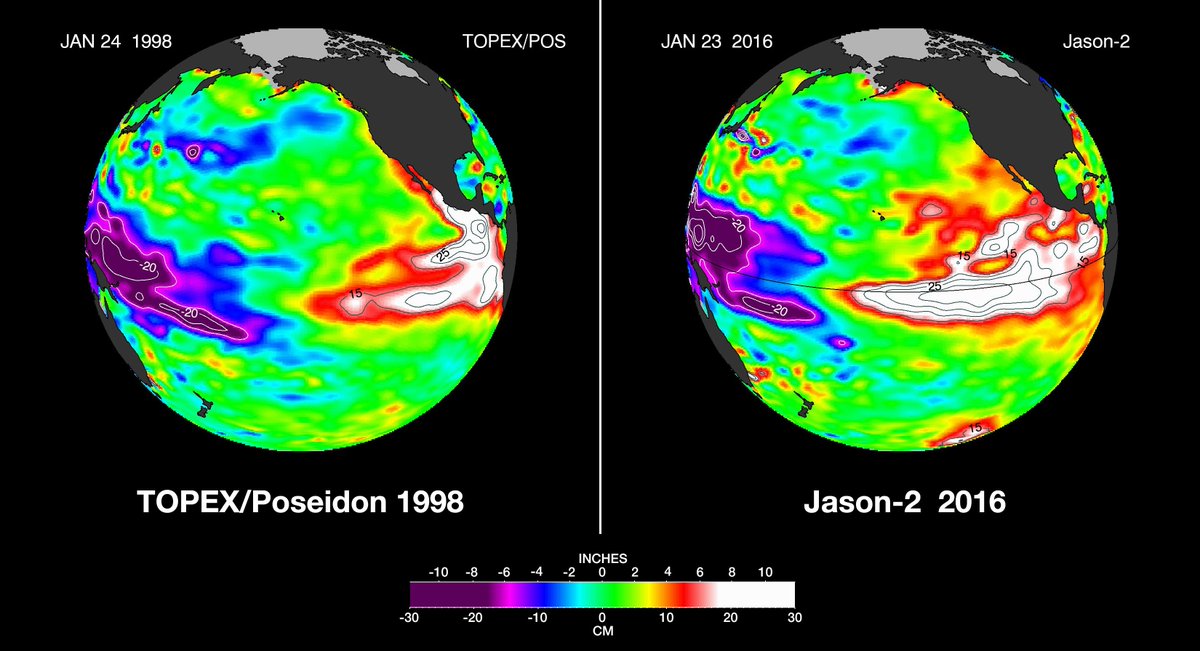
El Niño seems to have smashed 1997 record in past three months

Cultura RM/Richard Robinson
The evidence is in: we seem to be living though the most extreme of extreme weather events.

Last year, New Scientist reported early indications that the present El Niño event is probably the strongest ever recorded. A new analysis backs that view.

El Niño is a periodic phenomenon that occurs when ocean temperatures warm in the central and eastern Pacific Ocean. Even before this current event began, forecasters warned that it was likely to wreak havoc with the world’s weather.

“We have pretty much had it nailed since late summer, early fall that this was going to be a very strong El Niño,” says Jan Null, a meteorologist at Golden Gate Weather Services in Saratoga, California.

But just how strong? At the end of last year, the US National Oceanic and Atmospheric Agency (NOAA) revealed that water temperature in the central Pacific had reached 3.1 °C above average. That shattered the previous all-time high from 1997, when the water at the same time of year measured 2.8 °C above average.
Null’s analysis of NOAA’s fresh data bolsters this view. He finds that the past three months score a very strong 2.31 on the oceanic Niño index, one of the primary measures of anomalies in sea surface temperatures. That’s up from 2.26 for the last strongest El Niño, in 1997.
CaYjzoqUsAApgnt.jpg


CajU6yZWcAAFi_S.jpg

more
https://www.newscientist.com/articl...ave-smashed-1997-record-in-past-three-months/
 
Who is dreaming about El Niño episodes having to match calendar dates? El Niño is not Spring or Winter!

One WWB more and this Niño will beat 1997-8's because it's not just its peak value -otherwise "The Pause" existed, be coherent, for Darwin's sake- but the time span of average values (think of the "area under the curve"). Last Kelvin wave is passing through the 3.4 region now so values about 2.4 are expected to sustain for a couple of weeks, but later it is expected to drop very quickly below 1.5 by the first day of April. Again, a new WWB, even a mild one, within the next 5 weeks may extend the life of the present episode and make it the worst one on record (Of course this uses ENSO normals in the standard way, not in the convenient way many saw fitting to have the current episode enhanced and the 1997-8's played down).

Speaking of Australian climatic novelas, do you all remember the episode some 6 months ago when a glitch or a hacker altered the BOM's dependent Antarctic sea ice surface data so in-synch denialist websites shout the Antarctic ice was reaching a historic maximum? Well, it happens it won't reach a minimum but it'll come close!

Now he have the highest global sea ice surface anomaly on record for the first quarter -it has been worse while reaching Northern minimums in the third quarter during 2007 and 2012-. We have simultaneously the lowest values for these dates in the Arctic (just 13.3 million square kilometres by the end of January) while the Antarctic sea ice is going to be the second to fifth low on record when it reaches that point in 10 to 25 days. Only 1993 showed less Antarctic ice during February. As an interesting consequence, there are temperatures over 0°C all around the Antarctic Peninsula, what is not surprising as the highest for Antarctica is about 11°C in those areas, but there are forecasts of temperatures reaching highs above 0°C in many bases and stations all around the coast of the bulk of Antarctica (which is now totally sea ice free in more than 60%), and this is also not new, but so many at the same time indeed is.

Stay tuned, because we won't have to wait like from 1998 to 2005 to hear shocking news from the banquises.
 
By the way, TSI reached a maximum of almost 1408 W/m2 last January 6th -this is a leap year- but it has today dropped below the 1400 mark, and it's going down further.

Yet we have no answer for Haig explaining why this 0.6% drop hasn't implied global temperatures going down but slightly up. Wasn't it he knew everything about how Aton influences his subjects?
 
http://www.internationalskeptics.com/forums/showthread.php?t=293855

how is our star ?

are they still predicting a weakening solar cycle ?

how much less recent heat input ?
 
how is our star ?

are they still predicting a weakening solar cycle ?

how much less recent heat input ?

This is off topic for this thread but you can find good information in the following link and dig further if you wish.

https://www.skepticalscience.com/solar-activity-sunspots-global-warming.htm

on the above page under the graph
"TSI from 1979 to 2015 from PMOD (see the PMOD index page for data updates)."
which is here
Index of /pub/data/irradiance/composite/DataPlots/ ftp://ftp.pmodwrc.ch/pub/data/irradiance/composite/DataPlots/

Any further posts regarding general climate science should take place in the global warming discussion IV thread here.

http://www.internationalskeptics.com/forums/showthread.php?t=293855&page=33

Thx
 
Last edited:
This is off topic for this thread but you can find good information in the following link and dig further if you wish.

https://www.skepticalscience.com/solar-activity-sunspots-global-warming.htm

on the above page under the graph
"TSI from 1979 to 2015 from PMOD (see the PMOD index page for data updates)."
which is here
Index of /pub/data/irradiance/composite/DataPlots/ ftp://ftp.pmodwrc.ch/pub/data/irradiance/composite/DataPlots/

Any further posts regarding general climate science should take place in the global warming discussion IV thread here.

http://www.internationalskeptics.com/forums/showthread.php?t=293855&page=33

Thx
you said ''3. You may speculate on the trajectory of Sea Ice melting in here''

I would speculate there is a direct link in solar output and ice area changes
while not the only thing influencing the ice
it must be easy to track

btw the 15% ice area bothers me
as that is a loose standard if I read it right
84% ice free = 100% ice covered ?
 
Professor Jason Box on the Greenland ice sheet melt dynamics, black carbon, dark algae, the North Atlantic cold blob and it's proposed weather impacts and Antarctic Ice melt accelerating and surpassing Greenland's sea level contributions.

https://www.youtube.com/watch?v=SAfFtKWc4Lc

Earth-system climate models do contain those feedbacks he says climate models lack.
 
Let's put things in context. Greenland loses a volume of ice in a whole Summer that matches two good days of melting of the Arctic sea ice. The same for Antarctica -but make them three, for uncertainties-. That means that a warm spell in Baffin Bay or Greenland Sea can decrease water salinity much more than what Greenland melting can do in its surroundings. Of course it is not negligible but let's not dissociate this from the whole system to invent a narrative. Don't forget the Arctic Ocean has a lower salinity in its first hundreds of metres because a good year of snow in Siberia, Canada and Alaska throws up to a couple of Amazon Rivers of fresh water during several weeks during late Spring and early Summer (together with tens of millions of tons of methane liberated which will be replenish in Summer and trapped in early Autumn, another whacky narrative when taken isolated).

Contrary to others commenting here, I don't see a catastrophe in offices being closed and research resources being redirected, because there's a lot of "oracle syndrome" around. Just think the times we caught here the misdeeds of closeted denialists in official scientific institutions -for instance, the case of the polar sea ice comparison-. Well, there are hundreds or times more misdeeds coming from "warmers" in those.
 
you said ''3. You may speculate on the trajectory of Sea Ice melting in here''

I would speculate there is a direct link in solar output and ice area changes
while not the only thing influencing the ice
it must be easy to track

btw the 15% ice area bothers me
as that is a loose standard if I read it right
84% ice free = 100% ice covered ?

3. You may speculate on the trajectory of Sea Ice melting in here''
Fair enough. I didn't want to go OT in Ben's thread so thanks.

There are lots of feedback mechanisms changing the temperature and sea ice volume in the Arctic and one needs to look at many aspects of the science to better understand what is in play. Lots of variables.

Here is a presentation by long term Arctic research scientist Peter Wadhams of Cambridge University which is the best overview that I have seen yet. David Wasdell also has some good lectures from the work done with the Apollo Gaia project.

May 12, 2015 - FEEM Lecture: "Arctic Amplification, Climate Change, Global Warming"
https://www.youtube.com/watch?v=p-qdbICw2f8

The presentation is long but it needs to be. If you take the time to watch the entire video it will probably save you time in the long run. You may enjoy being able to have a much broader understanding of many of the feed backs and watch how they play out as various changes come into play.
As MacDoc mentioned changes in albedo of both ice and the snow on the surrounding land areas are a significant feedback mechanism and that is mentioned around 50:00 ish in the program.

I was going to show the time code for the place in the presentation where sea ice volume is mentioned but I think that would not be helpful if that is all that you ended up viewing, as all of the science is relevant.

If you want to check wind patterns, currents, ocean temperatures and sea surface temperature anomalies for the Arctic use the following live construct. I'm using it to monitor the frequency of the wind patterns that may push weak cracked ice out of the Fram Straight.

http://earth.nullschool.net/
 
Last edited:
you said ''3. You may speculate on the trajectory of Sea Ice melting in here''

I would speculate there is a direct link in solar output and ice area changes
while not the only thing influencing the ice
it must be easy to track

btw the 15% ice area bothers me
as that is a loose standard if I read it right
84% ice free = 100% ice covered ?

3. You may speculate on the trajectory of Sea Ice melting in here''
Fair enough. I didn't want to go OT in Ben's thread so thanks.

There are lots of feedback mechanisms changing the temperature and sea ice volume in the Arctic and one needs to look at various aspects of the science to understand what is in play. Lots of variables.

Here is a presentation by long term Arctic research scientist Peter Wadhams of Cambridge University which is the best overview that I have seen yet. David Wasdell also has some good lectures from the work done with the Apollo Gaia project.

May 12, 2015 - FEEM Lecture: "Arctic Amplification, Climate Change, Global Warming"
https://www.youtube.com/watch?v=p-qdbICw2f8

The presentation is long but it needs to be. If you take the time to watch the entire video it will probably save you time in the long run. You may enjoy being able to have a much broader understanding of many of the feed backs and watch how they play out as various changes come into play.
As MacDoc mentioned changes in albedo of both ice and the snow on the surrounding land areas are a significant feedback mechanism and that is mentioned around 50:00 ish in the program.

If you want to check wind patterns, currents, ocean temperatures and sea surface temperature anomalies for the Arctic use the following live construct. I'm using it to watch the wind patterns that may push weak cracked ice out of the Fram Straight.

http://earth.nullschool.net/
 
I don't see a catastrophe in offices being closed and research resources being redirected, because there's a lot of "oracle syndrome" around.

One of the local hair salons near here is closing. A few women may be exposed to alternative viewpoints.
 
ouch

Atmospheric CO2 Rocketed to 405.6 ppm Yesterday — A Level not Seen in 15 Million Years

As CO2 levels hit a new record global high of 405.66 ppm yesterday, I couldn’t help but think that HG Wells could not have imagined a more perilous mechanism for exploring the world’s past.

For when it comes to testing the range of new climate extremes, the present mass burning of fossil fuels is like stepping into a dark time machine. As all that carbon hits the airs and waters, the climate dial spins backward through hundreds of thousands and millions of years. Speeding us on toward the hothouse extinction eras of Earth’s deep history. Now, not only is it driving us on through extreme weather and temperature events not seen in 100, 1,000, 5,000 or even 10,000 years, it is also propelling us toward climate states that haven’t occurred on Earth for ages and ages.

*****

Ever since 1990, the world has experienced atmospheric CO2 levels in a range that hasn’t been seen since the Pliocene geological epoch. A period of time 2.6 – 5.3 million years ago hosting carbon dioxide levels ranging from 350 to 405 parts per million and global average temperatures that were 2-3 degrees Celsius hotter than 1880s levels. Overall, global sea levels towered about 80 feet higher than those humankind has grown accustomed to.

more
http://robertscribbler.com/2016/02/05/co2-rockets-to-405-6-ppm-a-level-not-seen-in-15-million-years/

There may be some leveling off in CO2 emissions rate of change but short of sucking it out with some as yet unknown tech....we done a pretty good job of altering the climate and the geography for an awfully long time into the future. :boggled:
 
Warm Northern Autumn. The Carbon is Back.

Record Warmed Ocean Waters. New Carbon is as Welcome as a Syrian Refugee.

One thing is clear: from November on we definitively left the 3XX range behind.

If we reach the 5XX range, we will have failed miserably the target.
 
Status
Not open for further replies.

Back
Top Bottom