Reading posts while logged out, I noticed ergo asked one interesting question:
What would the FTIR plots of nanothermite look like?
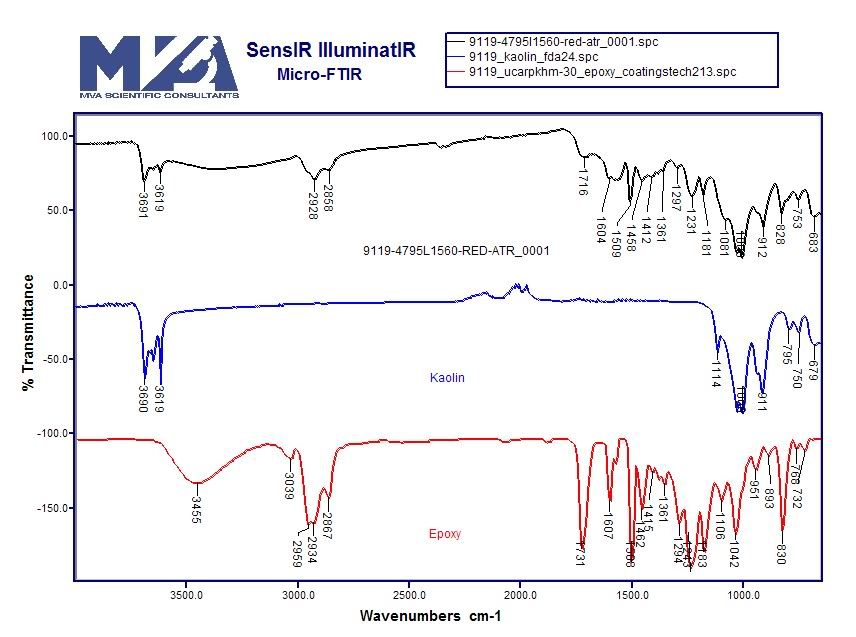
I am not an FTIR expert, but I would guess that FTIR spectra are cumulative. Like Millette shows in Appendix:
[qimg]http://i1088.photobucket.com/albums/i328/MikeAlfaromeo/Millette/MillettePreliminary/MillettePrelimApxC/9119-4795L1560-red-atr_0001_FTIRvsKaolinEpoxy.jpg[/qimg]
The red and blue lines are two ingredients, epoxy and kaolin (I believe from a database, not measured in the dust samples), the black line is the red layer of a chip. You can see how features of both ingredients show up in the curves of the composite: The peaks characteristic for Kaolin in the 3600s, and the peaks characteristic for epoxy around 2600.
The ingredients of nanothermite are obviously Al and Fe
2O
3, so if Millette could show, in his final paper, what the lines for these are, particularly Al (with the customary natural coating of Al
2O
3?), and that these lines don't show in the chips, that would show the doubters. And actually, it would give me some comfort, too.
Note: The chemical formula of Kaolin is often given as Al
2Si
2(OH)
4O
5, but also sometimnes written as Al
2O
3·2SiO
2·2H
2O, so I have the layman's suspicion that the FTIR spectrum of kaolin is a composite of the spectra of Alumina·Silica·Water.
How deep would FTIR penetrate into small Al particles? Would it primarily record the IR absorption of Al, or of the Alumina surface layer?
I found a practical guide to FTIR interpretation for the science-savvy:
http://infrared.als.lbl.gov/BLManual/IR_Interpretation.pdf
And other nice links:
http://infrared.als.lbl.gov/content/web-links/59-ftirarticles


")


")