Moderated Iron sun with Aether batteries...

Status
Not open for further replies.
Yes. We've discovered that Jupiter has a solid iron surface!


(Or maybe this just goes to show that only a true dyed-in-the-wool crackpot would fall for the optical illusion created by the dark light pixel arrangement in a running difference graph.)
Cool! :)

For completeness, was the process you used to create this the same as the one for creating the RD movie of the SDO (171A?) images you posted earlier in this thread? Apart from the colourisation of course!

Could you take one image from the RD movie, crop it so that it includes only part of Jupiter (i.e. no limb), and increase the contrast so the brightest pixels are saturated (white) and the darkest zero (black)? That way we could make a direct comparison with the first image on MM's website (of course, the image resolutions is different ...).
 
Yes. We've discovered that Jupiter has a solid iron surface!


(Or maybe this just goes to show that only a true dyed-in-the-wool crackpot would fall for the optical illusion created by the dark light pixel arrangement in a running difference graph.)

That's why the diameter of the disk in this specific wavelength is the issue GM. Did you "officially' ante up your public opinion on the diameter prediction, yes or no?
 
Science by Pretty Picture Fails Again II

This is so easy a child can do it. Literally. It has been described by others in many different ways already, throughout many pages of this long thread. Here is my installment in the ongoing effort to make it crystal clear to any & all that Mozina has no clue what he is looking at in his precious SDO press release image of the sun, despite his vociferous claims to the contrary.

Take a picture of a ball.
Make a mark on the picture, just below the limb of the ball.
Hold the ball oriented just the same as it is in the picture.
Make a mark on the ball that matches the mark on the picture.
Is the mark on the ball under the surface of the ball?
No, the mark on the ball is on the surface of the ball.
The mark on the 2-dimensional picture appears just below the limb of the ball.
The mark on the 3-dimensional real ball appears on the part of the surface of the ball that is extended towards you as you look at it.

Now repeat the entire process, but this time wrap the ball in clear plastic wrap.
Put the mark on the same place as you did before, for both picture & real ball.
Now the mark on the real ball is on the clear wrap, not on the ball.

Now repeat the entire process, but this time wrap the ball in multiple layers of colored plastic wrap.
Put the mark on the same place as you did before, for both picture & real ball.
Now the mark on the real ball is on the top layer of plastic wrap, not on the ball.
But you can see the ball, under the mark, and through the layers of plastic wrap.

Now hold up the ball and look at the mark.
Imagine a line from your eye to the mark, extending through the ball and into the distance.
That line is your line of sight.

Opacity is a quantitative measure of how much light will be absorbed by any given material, per unit mass.
Optical depth is a quantitative measure of how much light will be absorbed by any given material, along any given line of sight.
Opacity & optical depth depend explicitly on the wavelength of the electromagnetic radiation (visible light, X-rays, radio waves, etc.).
The walls of your house have a high opacity to sunlight, which is why you cannot see the sunlight through the wall.
The glass windows of your house have a low opacity to sunlight, which is why you can see the sunlight through the window.
If you sliced the material of your wall into a sheet thin enough, you could probably see sunlight through the wall.
It is a general rule that if you know what anything is made out of, and you know what its physical state is (temperature, pressure, etc.), then you can use the known fundamental laws of physics to compute the opacity & optical depth of that material.

As seen in visible light (that means light your eyeball can see), we can see that the sun has a "surface" of high opacity (always be sure to look at the sun only through an appropriate filter lest you burn holes in your retina and go blind like Galileo). In the standard physical model of the sun, that "surface" is the photosphere, and is actually a layer about 400 km thick. However, since it is also about 149,600,000 km away, it looks pretty thin from Earth, subtending an angle of 0.55 arcseconds if seen edge on. In the standard physical model of the sun we cannot see any electromagnetic radiation coming from below the bottom of the photosphere. In the standard physical model of the sun, we can see copious amounts of ultraviolet & X-ray & radio emission from the tenuous solar atmosphere above the photosphere, where we find (in order going up from the photosphere) the transition region, the chromosphere and the corona. In the standard physical model of the sun, these upper layers of the solar atmosphere are optically thin, meaning that we can see through them in much the same way as you can look through the multiple layers of colored plastic wrap around the ball above. Just pretend that the solid surface of the ball is the photosphere of the sun, and the layers of colored plastic wrap are the upper layers of the solar atmosphere, and you have the right idea, as anticipated by the standard physical model of the sun.

Now look at Mozina's pretty picture and assume that you know nothing except what you see in the picture, how Mozina chooses to physically interpret what he sees in the picture, and what is the standard physical model of the sun. He says the colors seen below the limb of the sun must be coming from under the photosphere, in violation of the standard physical model of the sun, as if we had cut the sun in half, and had a picture of the face of a half-sun, a cut-away diagram. But we now know from the exercise with the ball & colored wrapping paper above, just what is really going on. We would expect to see though the upper layers of the atmosphere, just as we see through the colored layers of wrapping, as the 3-dimensional real sun curves towards is. Any point below the rim of the 2-dimensional picture must be like the mark on the ball, a mark on the outer layers of the 3-dimensional sun extending towards us. We expect to see light coming from all of the transparent or translucent layers that wrap the sun, just as we see all the light from the colored wrapping around the ball, extended along our line of sight, all the way from our eyeballs (or telescopes) to the opaque layer of the sun. In other words, what we see in the picture is qualitatively consistent with what we expect to see given the standard physical model of the sun. Furthermore, if the standard physical model of the sun is in fact correct, then Mozina's interpretation of the images is readily seen as physically impossible and can be dismissed at once.

We can see from the simple geometry of the ball and colored wrapping that Mozina's interpretation of the 2-dimensional image is hard to reconcile with the 3-dimensional reality, whereas the 3-dimensional reality, the 2-dimensional picture and the standard physical model of the sun are all in qualitative harmony with each other. So a preference for the standard physical model over Mozina's questionable interpretation of a 2-dimensional picture is fairly obvious.

This all assumes that all we know are the picture, and the competing physical interpretations & models. Pointedly, we do not know that the features we are looking at are actual physical features of the sun, and not artifacts introduced either by the observing instrument, or by the process of generating the image. We now know that, according the the group of people who created the image, that the colored band by which Mozina hopes to derail all of modern physics, is in fact just that, namely an artifact introduced by the process of generating the image.

Mozina provides no quantitative reason to believe him and offers us only a subjective, qualitative interpretation of a press release picture. On the other hand, we have many thousands of pages of textbooks and research papers clearly documenting the standard physical model of the sun, and its provenance leading back to the known & established fundamental laws of physics. In the absence of more sophisticated reasoning than Mozina appears either willing or able to provide, his interpretation of this image, and all other images, must be rejected as unfit for human consumption.
 
Science by Pretty Picture Fails Again III

You have consistently failed to judge this solar model based on it's specifications. The irony of course is that it was the SSM that has been shown to be in violation of the laws of physics, not my model.
Au contraire, mon ami. The Mozina model of the sun has consistently failed each & every physical test to which it has ever been subjected, with no exceptions. The Mozina model consistently & always violates the laws of physics, and in fairly obvious fashion I might add, whereas the standard physical model of the sun has been quite a rousing success. There is more than ample information to be found in this thread alone to support my assertions made here.


My model "predicts" light can come up and through a highly ionized atmosphere. It's your solar model that flunked the physics test.
There is no observational evidence to support a "highly ionized" photosphere on the sun. Your claims that there is observational evidence hinge on your rather foolish attempt to physically interpret a feature found in a press release image, later authoritatively identified as an artifact of the process by which the image was created. Your model fails the simplest tests quite badly, whereas the standard physical model of the sun survives quite comfortably.

Decades of limited resolution and capability just got overturned in SDO images Tim. You seem to be ignoring the images entirely. LMSAL put the transition region in the wrong place Tim, just as I've said now for 5 years.
I do not ignore the images and neither does anyone else. Indeed, why would I ignore the images, since the images definitively reject your model? It is your interpretation of the images, and not the images themselves, which the entire civilized world rejects. We all reject your interpretation of the images because your interpretation significantly violates the laws of physics, and because your interpretation is at odds with even the simplest, child level understanding of the viewing geometry.

That transition region denoted by the limb dimming is located under the chromosphere, not inside of it, just as my solar theory predicts.
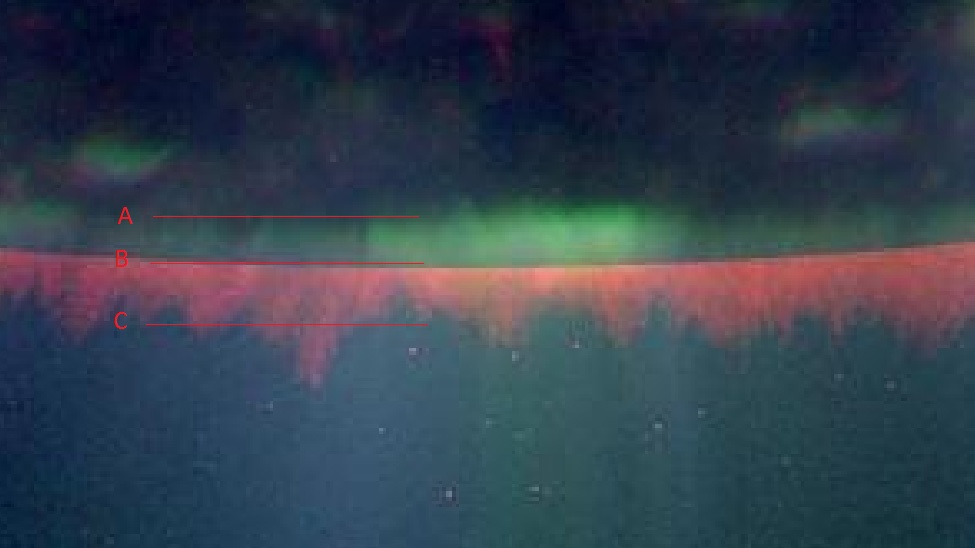
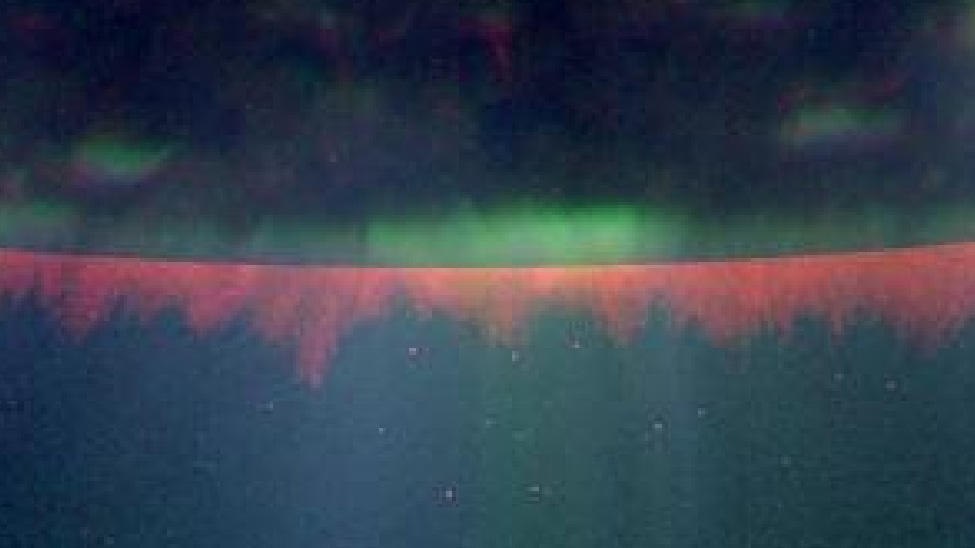
When did your solar theory begin predicting that? until now, you have been insisting that the transition region is under the photosphere, not the chromosphere. By the way, the standard physical model of the sun puts the transition region under the chromosphere, not inside it.
 
Science by Pretty Picture Fails Again IV

http://aia.lmsal.com/public/firstlight.html
http://aia.lmsal.com/public/firstlight/20100408_044515/f_211_193_171.jpg
http://aia.lmsal.com/public/firstlight/20100408_013015/f_094_335_193.jpg
http://aia.lmsal.com/public/firstlight/20100408_013015/f0193.gif

I defy you to find any iron ion wavelength in SDO that doesn't have a bright horizon line, and underneath of that bright line, an opaque limb. In fact I defy you to find any TRACE high resolution image of the limb that doesn't also show that same "feature". That is not an "artifact" Tim, it's in *EVERY* iron ion limb image of the sun.

Look at the image you posted here: http://www.internationalskeptics.com/forums/showthread.php?postid=5893632#post5893632
And the image posted by Gee Mack here: http://www.internationalskeptics.com/forums/showthread.php?postid=5895794#post5895794

The feature you are talking about in that image is a bright green band below the limb of the sun. That feature has been authoritatively identified as an artifact of the image creation process, by the people who actually created the image. End of story.

Now you are talking about something totally different, "a bright horizon line, and underneath of that bright line, an opaque limb". Since you defy me to find one that does not look like that, here one is: http://trace.lmsal.com/POD/images/T195_20060802_183218.jpg

What would one expect to see, given the standard physical model of the sun? One would expect to see a bright horizon line, and underneath of that bright line, an opaque limb, which is a common feature of most, though obviously not all such images. Why would one expect that? Once again, I am far from first to point this out, but every little bit helps I guess. The images are X-ray images. The chromosphere & corona, above the photosphere are particularly bright on X-rays, whereas the photosphere below generates no X-rays of its own, and is quite opaque to X-rays from below. It does not take a huge exercise of intellect to see that an X-ray image of the limb should show the bright X-ray emitting region above, and the dark photosphere below. That there might be a "bright line" between them is hardly surprising, simply because of the high contrast between bright & dark, and I would expect such a feature to be an artifact, in the absence of evidence to the contrary from the original science data.

In the image I linked above, such a bright line is not evident because there are many places where the contrast is not so great.

Science by Pretty Picture fails again, for the umpteenth time.
 
Pixels

You really need to get into the image at the pixel level to see these details, ...
One more example of the amateur approach to image processing. One must approach the "pixel level" with caution. The pixels on the AIA detector project onto the sky with angular size 0.6 arcseconds. I can't find the assumed or measured point spread function (PSF), but if it is Nyquist sampled (as is usually the case), then the PSF is likely about twice that, or 1.2 arcseconds in diameter. In the absence of resolution enhancement, one should never trust the physical reality of anything in an image that is smaller than the point spread function (which is the smallest physical unit that can be detected by the optics), or more appropriately the point response function (which is the convolution of the point spread function of the optics and the detector pixel).

This means that no feature smaller than 2x2 pixels is likely to be real, and you probably want something rather larger than that if you are serious. It also depends on redundancy, whether or not the image in question is a single image, or a mosaic of many strongly overlapping images. In other words, how many individual images contribute input to any given single pixel in the final image? If the answer is 1 or 2, the real pixel level is not trustworthy. If the answer is more, then it might be, but it depends critically on the image restoration technique.

The lesson here is never blindly trust any image at the level of single pixels.
 
Mozina:
You do not have a "theory." A scientific theory is developed by people who understand scientific methods and scientific data. You are as qualified as an illiterate bushman to develop scientific theories. Your comments about "barking math," "math bunnies," your obvious ignorance of the laws of physics and basic mathematics all expose you as a pretender, with a childish obsession and a touch of megalomania. You have been embarrassing yourself for weeks here on this thread. In order for any hypothesis to be elevated to a viable scientific theory, intimate knowledge and understanding of relevant scientific principles and data is required; absent those fundamentals, hypotheses are merely baseless speculations, wild guesses, which in your case are astonishingly naive. Give it up!
 
Last edited:
Yes. We've discovered that Jupiter has a solid iron surface!


(Or maybe this just goes to show that only a true dyed-in-the-wool crackpot would fall for the optical illusion created by the dark light pixel arrangement in a running difference graph.)

Looks more like a meatball to me. :xcool
 
Mozina:
You do not have a "theory." A scientific theory is developed by people who understand scientific methods and scientific data.

Well, that would leave out this crew IMO. "Dark energy" isn't a "theory", nor is "inflation". These folks just "make up" whatever they like and add math. The problem here PS is that in this case the SSM has to actually pass the observation test and it does not. That green light all around the limb defies the predictions of the SSM. It is not supposed to be there. The notion that limb dimming is some sort of "artifact" is absurd. Tell me which part of the clock do you *NOT* see limb dimming?

http://aia.lmsal.com/public/firstlight/20100408_013015/f0193.gif
 
One more example of the amateur approach to image processing.

I can't even believe you seem to think "pixel counting" is "amateurish". No wonder you can't figure anything out in a satellite image! Disk? What disk? Flying stuff? What flying stuff? White light images? What what light images? Satellite image analysis is completely and totally lost on this group. If you don't get in there and count anything, how do you have any idea what's going on?
 
There is no observational evidence to support a "highly ionized" photosphere on the sun.

sd01.jpg


Pure denial on your part Tim. Notice those green iron lines coming up through your supposedly "opaque" region? That just destroys your SSM theory.
 
I do not ignore the images and neither does anyone else.

Of course you do Tim. You ignored that white light image I asked you to look at. You ignored all the mass flow images I showed you from Hinode. You ignored that SDO iamge entirely and bought some ridiculous notion that limb dimming is some kind of "artifact" when it is clearly present in *EVERY* iron ion image.
http://aia.lmsal.com/public/firstlight/20100408_013015/f0193.gif

Which part of that image image does not experience limb dimming Tim? Name the position on the clock where you *DO NOT* find that "feature"?
 
Take a picture of a ball.
Make a mark on the picture, just below the limb of the ball.
Hold the ball oriented just the same as it is in the picture.
Make a mark on the ball that matches the mark on the picture.
Is the mark on the ball under the surface of the ball?
No, the mark on the ball is on the surface of the ball.
The mark on the 2-dimensional picture appears just below the limb of the ball.
The mark on the 3-dimensional real ball appears on the part of the surface of the ball that is extended towards you as you look at it.

MM, acknowledge this.
 
...Birkeland's theory....
Birkeland would be horrified to be associated with your fantasy* of a iron crust.
Birkeland would be horrified to be be thought so ignorant of physics that he did not know about basic thermodynamics.

* Micheal Mozina's iron crust has been debunked!
The fact that it fails many other observations (an iron crust at a temperature of > 9400 K :jaw-dropp ) and predicts absolutely nothing just makes it a joke. See the over 60 questions that Michael Mozina is incapable of answering.
 
Why was the resolution in the STEREO data not enough to "make a convincing case"

I was disappointed to be sure. There simply was not the resolution necessary IMO to make a convincing case. Thanks to SDO that has all changed.
This was in reply to
Originally Posted by Michael Mozina - 02/09/2006
[Skeptic Friends Network]: I hear you on that point. I've already stuck my neck *WAY* out on a limb with the STEREO program. I'm betting the farm that they'll "discover" that the 171A, 195A, and 284A image originate *underneath* the photosphere, not above it. That's a real falsification mechanism that I'll accept as a viable way to determine which "interpretation" is accurate, and there should not be much room for error. I'm going to pay close attention to that data, I assure you. I'm interesting in both proving my case and also in falsifying it as well.

First asked 9 May 2010
Michael Mozina,
Why was the resolution in the STEREO data not enough to "make a convincing case"?

In other words:
How did you calculate the resolution data needs to have to make your case?

And an allied question:
First asked 9 May 2010
Michael Mozina,
Does the SDO data have the needed resolution?
Or are you going to move the goalposts yet again?
 
Last edited:
Micheal Mozina's iron crust fantasy has been totally debunked

This iron crust within the Sun idea of Micheal Mozina is very easy to disprove (big surprise :eye-poppi!): It is thermodynamically impossible since it must be at a temperature of at least 9400 K (as measured within the photosphere) and so be a plasma. This has been pointed out to MM many times over the years. Here are some of the explanations given to him that he continues to not be able to understand:
This alone makes his idea into a complete fantasy and his continued belief with it a delusion and so we could stop there but... The continuous issuing of unsupported assertions, displays of ignorance of physics and fantasies about what he imagines in images are illustrated in this list of unanswered questions. The first question was asked on 6th July 2009.

  1. What is the amount of 171A light emitted by the photosphere and can it be detected?
  2. What discharge rates and processes come from your hypothetical thermodynamically impossible solid iron surface to show up as records of change in the RD animation in the corona.
  3. Where is the the solar wind and the appropriate math in Birkeland's book?
  4. Please cite where in his book Birkeland identified fission as the "original current source"
  5. Please cite where in his book Birkeland identified a discharge process between the Sun's surface and the heliosphere (about 10 billion kilometers from the Sun).
  6. Coronal loops are electrical discharges?
  7. Can Micheal Mozina answer a simple RD animation question?
  8. More questions for Michael Mozina about the photosphere optical depth
  9. Formation of the iron surface
  10. How much is "mostly neon" MM?
  11. Just how useless is the Iron Sun model?
  12. Coronal loop heating question for Michael Mozina
  13. Coronal loop stability question for Michael Mozina.
  14. Has the hollow Iron Sun been tested?
  15. Is Saturn the Sun?
  16. Question about "streams of electrons" for Micheal Mozina
  17. What is the temperature above the iron crust in the Iron Sun model?
  18. What part of the Sun emits a nearly black body spectrum with an effective temperature of 5777 K?
  19. Is the iron surface is kept cooler than the photosphere by heated particles?
  20. Entire photon "spectrum" is composed of all the emissions from all the layers
  21. Same event in different passbands = surface of the Sun moves?
  22. Why neon for your "mostly neon" photosphere?
  23. Where is the "mostly fluorine" layer?
  24. What is your physical evidence for "mostly Li/Be/B/C/N/O" layers?
  25. What is your physical evidence for the "mostly deuterium" layer?
  26. Explain the shape of your electrical arcs (coronal loops)
  27. What is your physical evidence for the silicon in sunspots?
  28. How do MM's "layers" survive the convection currents in the Sun?
  29. Where are the controllable empirical experiments showing the Iron Sun mass separation?
  30. How can your iron "crust" not be a plasma at a temperature of at least 9400 K?
  31. How can your "mountain ranges" be at a temperature of at least 160,000 K?
  32. Where is the spike of Fe composition in the remnants of novae and supernovae?
  33. Which images did you use as your input for the PM-A.gif image, etc.?
  34. Where did your "mountain ranges" go in Active Region 9143 when it got to the limb?
  35. Do RD movies of inactive regions show "mountain ranges"?
  36. Just how high are your "mountain ranges"?
  37. How does your iron crust exist when there are convection currents moving through it?
  38. Why does the apparent height of your "mountain ranges" depend on the timing of source images for the RD process when the light sources and mountains in the images are the same?
  39. Why does the lighting of your "mountain ranges" move depending on the RD process?
  40. Why are the coronal loops in the RD images aligned along your "mountain ranges" rather than between them as expect fro electrical discharges?
  41. Why are the sunspot umbra not "mostly" iron plasma (Fe was also detected by SERTS as was C and a dozen more elements)?
  42. Can you show how you calculated that "3000-3750 KM" figure for the photosphere depth?
  43. How did you determine that the filaments "abruptly end right there"?
  44. Citation for the LMSAL claim that coronal loops all originate *ABOVE* the photosphere?
  45. Citation for Birkeland's prediction for the speed of the solar wind
  46. How did you measure the curvature of penumbral filaments in the Hinode images?
  47. How does your Iron Sun fantasy create the observed magnetic field of the Sun?
  48. Calculation for the depth of the SOT_ca_061213flare_cl_lg.mpg filament?
  49. Can you understand that the photosphere is defined to be opaque?
  50. A comment on MM's ability to interpret images: No little plasma (penumbral) filament!
  51. Where has any one in this thread claimed that the umbra is 2D?
  52. Is Michael Mozina's claim of measuring the curvature of the filaments true?
  53. Do you understand how fluorescent tubes ("neon bulbs") work?
  54. Can you explain why limb darkening does not diisprove your model?
  55. Why is the SERTS data on the corona applicable to sunspots?
  56. Please define a "current carrying plasma" from a textbook.
  57. How does the SERTS data show that all of the neon and silcon in the Sun's atmosphere is highly ionized?
  58. Where is the solar model that predicts the SDO images in Birkeland's book? (really a follow on to questions dating from July 2009)
  59. Where does the current from your impossible iron crust come from?
  60. Did you cherry pick the SDO image to support your fantasy? - the answer is yes. MM saw a "green line" in one PR image and ignored its absence in another.
    The SDO image"green line" is a processing artifact as confirmed by the NASA team.
    But anyway
    What went wrong with your counting of pixels in the SDO image?
    Where are your calculations that the SDO artifact has a width of *EXACTLY* 4800 km
  61. This post deserves mentioning: Math Bunnies & Image Bunnies
  62. Can Micheal Mozina understannd simple geometry?
  63. What is wrong with W.D.Clinger's calculation?
    Two recent questions but I fully expect the MM will be able to refute the geometry textbooks :rolleyes: !
  64. Got numbers, Michael Mozina? or What real quantified predictions come from Michael Mozina's Iron Sun fantasy? Is MM's idea complete useless :eye-poppi?
  65. Can you cite the paper where Kosovichev states that "those loops are mass flows" (coronal loops?)?
  66. Are galaxies electrical discharges from magnetized iron spheres (Birkelands "nebulae model")?
  67. How can we detect the less than 1 photon per year from your iron crust?
  68. Can you understand that the disk radius in RD images depends on solar activity?
  69. Will you yank down your web site as promised after your prediction failed?
  70. Why are you still ignoring that measurements show the chromosphere, etc. above the photosphere?
    (this happens to be one reason why MM is called a crank)
Micheal Mozina has a habit of essentially labeling Kristian Birkeland as having no knowledge of physics, e.g. the simple thermodynamics that make an iron crust impossible.
Not really a question, just a list of the symptoms of a crank or crackpot that MM displays
 
sd01-2.jpg


Michael, which line points to the boundry between the photosphere and the chromosphere?
 
Status
Not open for further replies.

Back
Top Bottom